Adaptation of students with disabilities to inclusive education environments
Фотографии:

ˑ:
Dr.Med, Professor L.V. Kapilevich1, 2
Postgraduate Е.V. Medvedeva2
PhD, Associate Professor A.A. Ilyin3
PhD, Associate Professor K.V. Davletyarova2
1National Research Tomsk State University, Tomsk
2National Research Tomsk Polytechnic University, Tomsk
3Tomsk University of Control Systems and Radioelectronics, Tomsk
Keywords: health disabilities, inclusive education, adaptation, physical activity.
Background. As things now stand in Russia, a growing priority is given to the problems of the disabled people’s isolation and their social, physical and mental adaptation [3, 5]. Most of the children with physical and health disabilities face a variety of physical adaptation problems in the changing environments of the modern inclusive education process [1, 2, 4].
Adaptability to variable conditions of external and internal environments is one of the unique qualities of the human body. Physiological adaptation may be described as a dynamic process associated with transformations of the homeostasis functionality at every new control level. Knowing logics of the functionality system, one may apply different tools of special effect on its elements to speed up the individual adaptation to the variable environmental conditions i.e. effectively control the adaptation process [6, 7].
Objective of the study was to analyse the content of a practical testing system to monitor the adaptation process of students with disabilities in the inclusive professional education environments.
Methodology and structure of the study. The study was performed in two stages: at the beginning (September) and end (May) of the academic year, with 39 first-year students of 18-19 years of age being subject to the study. Students with physical and health limitations (n=28) were split up into the following two groups: Group 1 composed of people with musculoskeletal system pathologies; and Group 2 with visual impairments. Reference group (n=11) was composed of healthy students. The subjects’ mental and physiological statuses were profiled by the questionnaire survey to obtain the anxiety rates (T.A. Nemchin’s Tension Index); functional state; mental activity rates; plus self-rates of social, mental, emotional and physical adaptability. The physiological function control mechanisms and rehabilitation abilities were rated by cardiointervalographic (CIG) method using ECG Trigger MKA-2 Test System. The method yielded the primary vegetative tonus, vegetative reactivity, vegetative activity control rates and response to orthostatic load typing data. The test data were processed and presented as mean arithmetic + mean error (М±m); with the significance of the intergroup differences rated by the Mann-Witney non-parametric criterion.
Study results and discussion. The mental and physiological status rating data arrays showing the highest differences are given on Figure 1 hereunder.
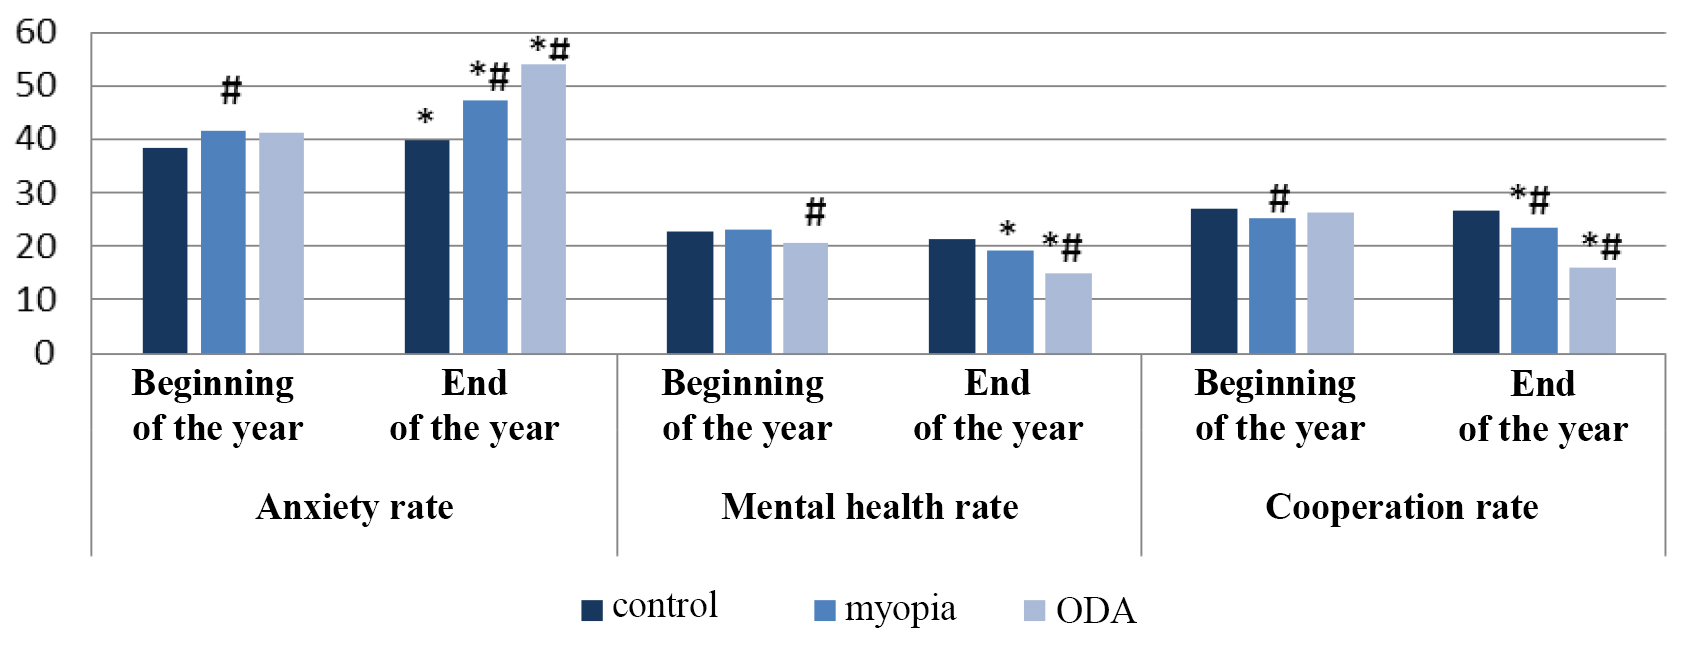
Figure 1. Mental and physiological status rates
* Significance of the year-beginning versus year-end intra-group data difference, p<0.05;
# Significance of the EG versus RG difference, p<0.05
ignificantly growing in both of the Experimental Groups (to 47.2±4.19 and 54,0±1,47 in the EG-2 and EG-1, respectively); versus the falling mental health rate (to 19.20±3.07 and 15.0±1.75 in the EG-2 and EG-1, respectively) and social cooperation rate (to 23.40±2.25 and 16.0±0.92 in the EG-2 and EG-1, respectively); with the data variations more expressed in the EG-1 (with musculoskeletal system pathologies).
Furthermore, the EG-1 subjects were tested with the expressed drops in emotional status (from 12.25±1.49 to 7.0±0.1), psycho-emotional tension rate (from 18.0±1.47 to 9.0±0.05) and comfort rate (from 11.75±0.1 to 9.0±0.04); versus the EG-2 (with myopia) that showed some drop only in the tension rate (from 16.57±1.43 to 13.80±2.56). In addition, both of the study groups were tested with a fall in the social-mental adaptability rate by the end of the year albeit their emotional adaptability rate was tested to notably grow (from 7.75±1.7 to 14.0±0.41 in the EG-2; and from 6.14±0.14 to 10.8±0.17 in the EG-1) versus RG that showed virtually no changes: see Figure 2.
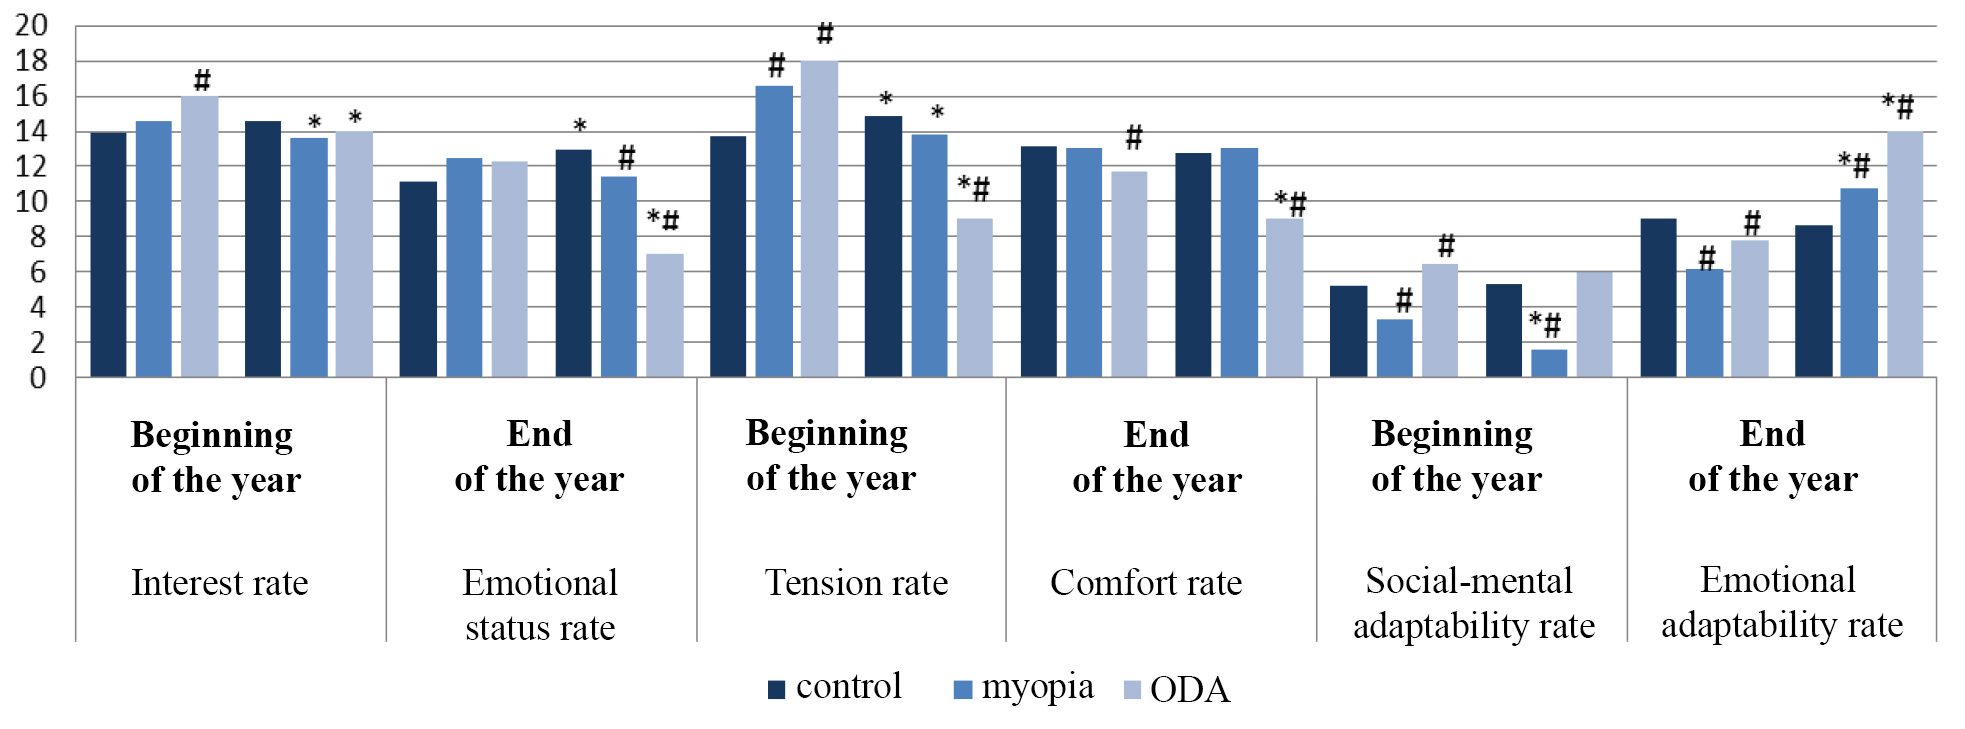
Figure 2. Functionality and adaptability rates
* Significance of the year-beginning versus year-end data difference, p<0.05;
# Significance of the EG versus RG difference, p<0.05
The cardiointervalographic (CIG) data (see Tables 1 and 2) in every group at the beginning of the year were about the same at rest, with some domination of the variation range (dX) in the RG: see Table 1. By the end of the year, EG-1 showed growth of the mode (Мо) and variation range (dX) versus the falling variation range in RG. The mode amplitude (АМо) was tested to fall by the end of the year in every group; and the tension rate was tested to grow in EG-2. The heart rate (HR) showed some (albeit insignificant) growth in every group by the end of the year: see Table 1.
Table 1. Resting heart rate in the first-year students, Хmean± m
|
Test rates |
RG |
EG-2 |
EG-1 |
|||
|
Beginning of the year |
End of the year |
Beginning of the year |
End of the year |
Beginning of the year |
End of the year |
|
|
Мо |
0,64±0,08 |
0,74±0,08 |
0,61±0,05* |
0,77±0,08 |
0,73±0,07* |
0,94±0,08# |
|
dX |
0,85±0,09* |
0,57±0,06 |
0,71±0,06# |
0,5±0,06 |
0,51±0,08*# |
0,65±0,04 |
|
АМо |
28,8±1,5* |
19,7±2,1 |
35,4±4,1* |
13,4±1,3 |
29,1±1,4* |
15,5±1,7 |
|
TR |
66,4±7,3 |
88,2±9,5 |
71,2±8,5* |
114,1±4,4# |
71,9±8,1* |
129,7±9,4# |
|
RRmean |
0,75±0,08 |
0,71±0,07 |
0,8±0,6 |
0,57±0,04 |
0,79±0,08 |
0,61±0,07 |
|
HR |
69,9±7,4 |
75,9±8,3 |
77,5±8,7 |
84,4±8,3 |
75,5±8,9 |
86,4±9,1 |
- Significance of the year-beginning versus year-end data difference, p<0.05;
# Significance of the EG versus RG difference, p<0.05
TR tension rate HR heart rate
The response to orthostatic load typing data showed the lowest Мо rates at the beginning of the year in EG-2 versus RG; and the highest year-end rate in EG-1: see Table 2. The variation range at the beginning of the year was the lowest in EG-1; versus the year-end variation range being virtually the same in all the three groups. Mode amplitude in EG-1 and EG-2 was tested to fall by the end of the year. Mean RR interval (RRmean) was the lowest at the beginning of the year in EG-1: see Table 2.
Table 2. Heart rates after the orthostatic probe in the first-year students, Хmean± m
|
Test rates |
RG |
EG-2 |
EG-1 |
|||
|
Beginning of the year |
End of the year |
Beginning of the year |
End of the year |
Beginning of the year |
End of the year |
|
|
Мо |
0,71±0,08 |
0,65±0,07 |
0,53±0,05# |
0,44±0,05 |
0,75±0,09 |
0,86±0,09# |
|
dX |
0,94±0,1* |
0,73±0,04 |
0,81±0,09 |
0,62±0,07 |
0,44±0,05*# |
0,68±0,05 |
|
АМо |
19,4±1,6 |
17,7±1,6 |
23,4±1,3* |
14,5±1,5 |
23,7±1,8* |
11,7±1,4 |
|
TR |
78,8±8,4 |
104,5±11 |
101,4±11* |
129,3±13# |
104,1±11* |
141,2±16# |
|
RRmean |
0,84±0,09 |
0,9±0,08 |
0,93±0,1 |
0,71±0,08 |
1,01±1,2* |
0,91±0,09 |
|
HR |
90,5±12 |
96,7±14 |
95,6±10,5 |
105,5±14 |
97,7±17 |
108,2±20 |
* Significance of the year-beginning versus year-end data difference, p<0.05;
# Significance of the EG versus RG difference, p<0.05
TR tension rate HR heart rate
Conclusion. The study data showed that the influences of the sympathetic and hyper-sympathetic mechanisms of the autonomous nervous system tend to grow by the end of the academic year and cause negative effects on the disabled students’ adaptability to physical and intellectual loads. The negative effects were shown in the growing Мо indices, variation range, tension index, and falling Mo amplitude. It should be noted that the physically most inactive group of disabled students (with musculoskeletal disorders) was found most vulnerable to the negative effects of the inclusive education environments and the least adaptable to the latter.
The study was financed by the Russian Research Fund (Project #16-18-00016)
References
- Boykov D.I. Inklyuzivnoe obrazovanie v informatsionnom obshchestve: problemy i perspektivy [Inclusive education in information society: problems and prospects]. Universum: Vestnik Gertsenovskogo universiteta. 2010, no. 1, pp. 121-125.
- Konanova E.I. Organizatsiya inklyuzivnogo obrazovatelnogo prostranstva v vuzakh Rossii dlya uchashchikhsya s ogranichennymi vozmozhnostyami zdorovya [Building inclusive educational space for students with disabilities in Russian universities]. Concept, 2015, no. 8, pp. 136-140.
- Smolonskaya A.N. Sotsialnye aspekty inklyuzivnogo obucheniya detey s ogranichennymi vozmozhnostyami zdorovya [Social aspects of inclusive education for children with disabilities]. Vestnik Kostromskogo gosudarstvennogo universiteta. Seriya: Pedagogika. Psikhologiya. Sotsiokinetika, 2009, no. 4, pp. 238-243.
- Sorokoumova S.N. Psikhologicheskie osobennosti inklyuzivnogo obucheniya [Psychological characteristics of inclusive education]. Izvestiya Samarskogo nauchnogo tsentra RAN, 2010, no. 3-1, pp. 134-136.
- Khalimova N.M., Naydanova O.S. Osobennosti sotsialnoy adaptatsii detey s ogranichennymi vozmozhnostyami zdorovya v usloviyakh inklyuzivnogo obrazovaniya [Specifics of social adaptation of children with disabilities within inclusive education]. Vestnik KGPU im. V.P. Astafyeva, 2014, no. 3 (29), pp. 127-130.
- Davlet'yarova, K.V., Korshunov, S.D., Kapilevich, L.V., Rogov, A.V. Biomechanical characteristics of walking of patients with cerebral palsy // Teoriya i Praktika Fizicheskoy Kultury. 2015. Issue 7. P. 26-28.
- Illarionova, A.V., Kapilevich, L.V. Distinctive features of intramuscular and intermuscular coordination at power graduation in the context of balance training // Teoriya i Praktika Fizicheskoy Kultury. 2014, Issue 12, P.44-46.
Corresponding author: kapil@yandex.ru
Abstract
Objective of the study was to analyse the content of a practical testing system to monitor the adaptation process of students with physical and health disabilities in the inclusive professional education environments. A set of mental and physiological condition rating tests was applied in the study to type the adaptation models of students with disabilities in the academic environments, the models being determined by both the individual traits and mindsets and the objective influences of the social environments.
The study data were applied to rate effects of the physical disabilities on the individual adaptation in the inclusive education environments. As was found by the study, influences of the sympathetic and hyper-sympathetic mechanisms of the autonomous nervous system tend to grow by the end of an academic year and cause negative effects on the disabled students’ adaptability to physical and intellectual loads. The negative effects were shown in the growing Мо indices, variation range, tension index, and falling Mo amplitude. It should be noted that the physically most inactive group of disabled students was found most vulnerable to the negative effects of the inclusive education environments and the least adaptable to the latter.


 Журнал "THEORY AND PRACTICE