Players' ranking analysis versus team competitive success in EURO-2016
Фотографии:

ˑ:
PhD, Associate professor A.I. Petrov1
D.A. Petrova2
1Tyumen Industrial University
2Ural Federal University named after the first President of Russia B.N. Yeltsin
Keywords: football, Euro-2016, competitive success rate, total market value of national team players, rankings.
Background. Prior to the 2016 UEFA European Championship commonly referred to as Euro-2016, the Russian national team was ranked number 21 on the UEFA rating list as of 02.06.2016. On the list of the Euro-2016 competitors it was ranked higher than such nations as, for instance, the Czech Republic (number 22), Ireland (23), Iceland (24), Sweden (25) and Albania (28). This position was considered very promising for the potential team success in the Euro-2016 Finals. However, the team failed to make it to the finals. The similar failures were experienced by a few other teams including Ukraine (24th place in the final team standings), Austria (22), Czech Republic (21), Spain (ex-European champion, 10) and England (12).
The Euro-2016 Finals were particularly successful, in opinions of both the specialists and public opinion, for a few teams including Portugal, a new European Champion, France, a vice-Champion, Wales and Iceland (with their 3rd and 8th places in the final team standings, respectively). It should be noted that no matter how fair the final team ranking table of Euro-2016 may be, it still gives little if any chance to understand how well the primary resources of every team have been mobilised for success at Euro-2016. We have made an attempt in this study to analyse the degrees of the primary resources of the teams mobilised for success using the total market value of the national team players as a key success rating factor.
Objective of the study was to rate performances of the Euro-2016 Final competitors by the total market values of the national team players versus their actual ranking places they won at the event.
Methods and structure of the study. We applied two relevant databases for the study: one was the Euro-2016 data and analyses available at www.sport-express.ru [1]; and the other providing the market values of the national team players at www.transferktmarkt.de [2]. Based on the above data, we calculated regression ratios of the team standings at Euro-2016 Reuro-2016 = f(R€) to the team rankings by the total market values of their players R€ prior to the event. Theoretical grounds for the study may be found in our previous study [3].
The regression curves Reuro-2016 = f(R€) were drawn in the coordinate system of Team Standing at Euro-2016 versus the Team Ranks by the Total Market Values of the Players sized 24x24, with reference points indicating the expectable (ideal) places of the teams on the assumption that the final team standings are strictly determined by the total market values of their players. Those teams that performed better than could be expected based on the total market values of their players are found under the regression line; and the teams that failed to meet prior expectations (based on the total market values of their players) take different positions above the regression line. The distance from the relevant actual performance point to the approximation line (of the ideal performance points) gives the reasons to rate the degrees of successes/ failures of the teams at Euro-2016. We believe that the total market values of the team players provide a fairly accurate basis for actual successes of the national teams at Euro-2016 being objectively measured.
Study results and discussion. Given in Table 1 are the input data mined to mark the reference points and actual performance points on the coordinate system using the total market values of the team players and the final team standing points.
Table 1. Ranks (team standings) of the Euro-2016 competitors versus the total market values of their players as of June 2016 [1, 2]
|
Actual rank (team standing) at Euro-2016 |
National team |
Total market value of the team players, € mln. |
Calculated (estimated) team rank based on the total market value of the players |
|
1 |
Portugal |
321,70 |
6 |
|
2 |
France |
454,00 |
4 |
|
3 |
Wales |
168,30 |
12 |
|
4 |
Germany |
562,00 |
1 |
|
5 |
Italy |
272,00 |
8 |
|
6 |
Belgium |
460,90 |
3 |
|
7 |
Poland |
175,30 |
10 |
|
8 |
Iceland |
41,55 |
21 |
|
9 |
Croatia |
272,25 |
7 |
|
10 |
Spain |
557,50 |
2 |
|
11 |
Switzerland |
172,50 |
11 |
|
12 |
England |
446,00 |
5 |
|
13 |
Hungary |
27,30 |
24 |
|
14 |
Ireland |
89,30 |
17 |
|
15 |
Slovak Rep. |
91,10 |
16 |
|
16 |
Northern Ireland |
35,90 |
23 |
|
17 |
Turkey |
186,05 |
9 |
|
18 |
Albania |
40,88 |
22 |
|
19 |
Romania |
55,95 |
20 |
|
20 |
Sweden |
86,85 |
18 |
|
21 |
Czech Rep. |
64,45 |
19 |
|
22 |
Austria |
128,35 |
15 |
|
23 |
Russia |
133,50 |
13 |
|
24 |
Ukraine |
128,65 |
14 |
It is clear, however, that a final actual rank (standing) of a team may not be simply and directly derived from the total market values of the team players. To confirm this statement, let us compare on the Figures hereunder the chart of the ideal correspondence of the team standing with the total market value of its players (Case A) with the actual rank (standing) of the teams at Euro-2106 (Case B). It may be only pertinent to refer, having considered Case B, to the usual philosophy of both the game specialists and supporters who use to say something like “this is football... the ball is round” when a lower-ranking team beats a favourite.
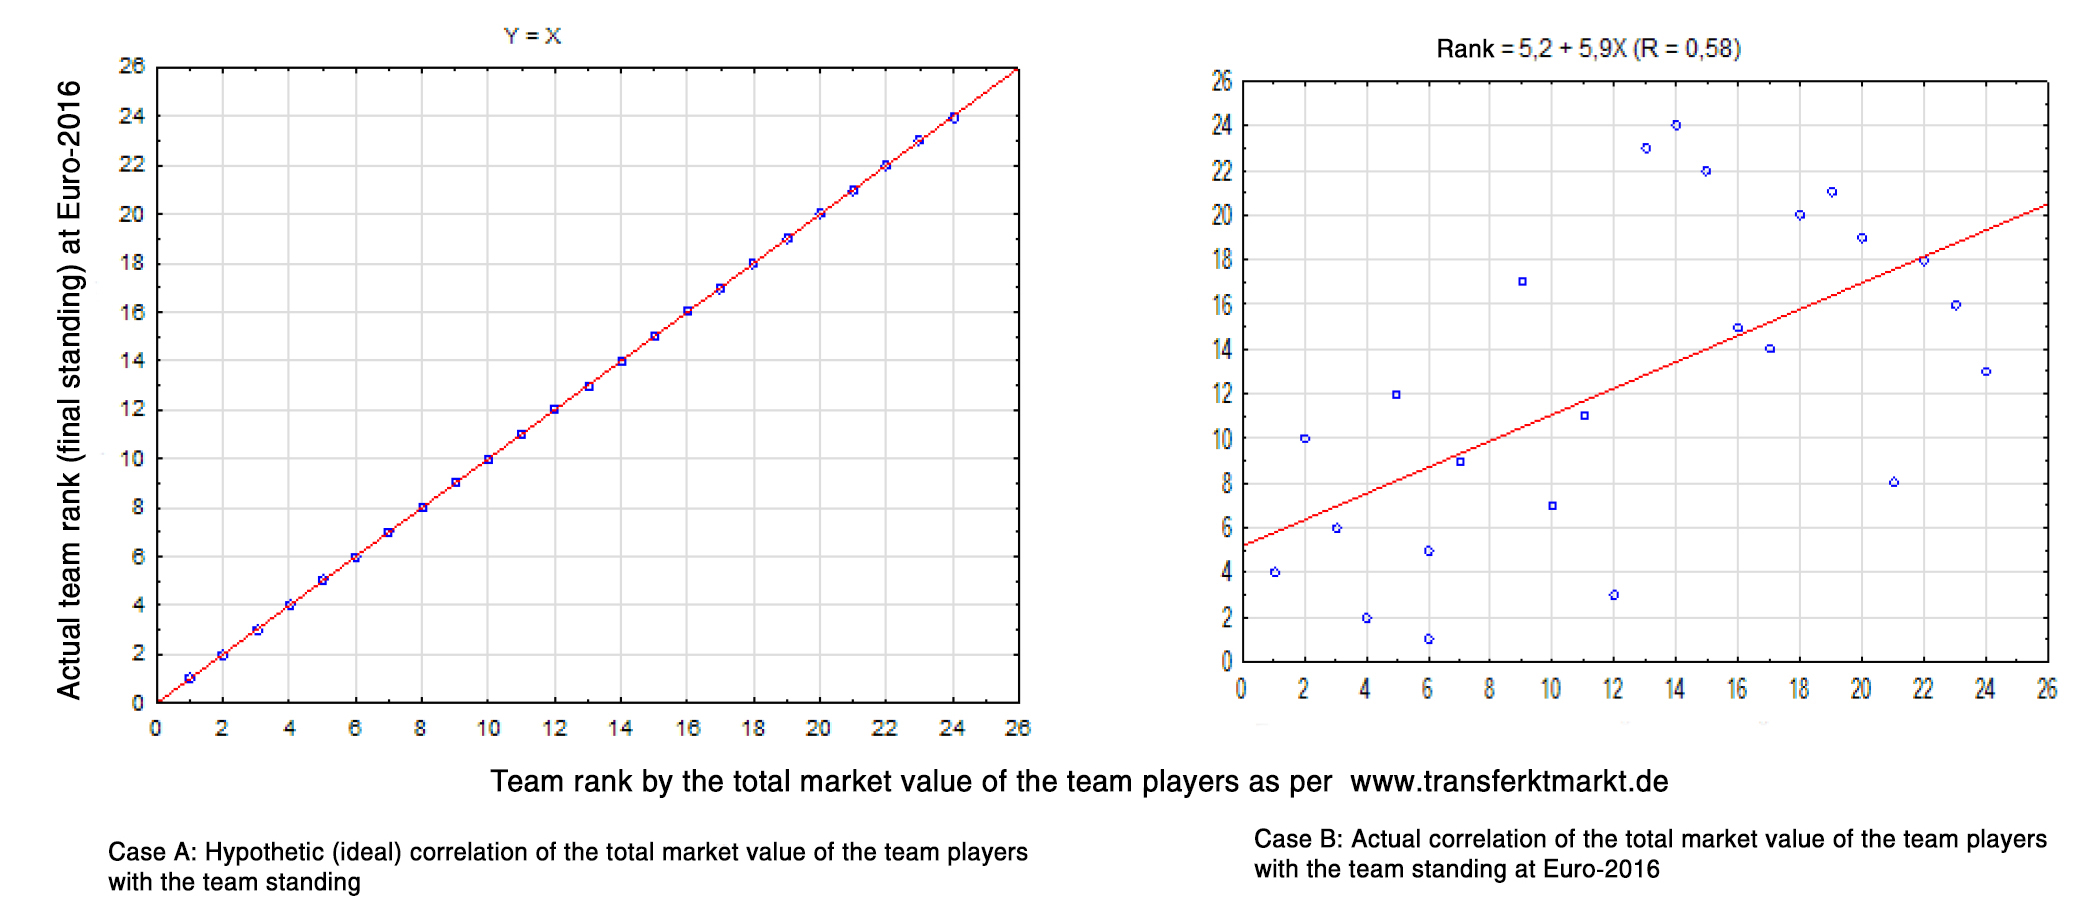
Figure 1. Hypothetic (ideal) correlation of the total market value of the team players with the team standing (Case A) versus the actual team standing (Case B)
Case B on Figure 1 shows the average correlation of the total market value of the team players with the actual team standing at the event being low enough (R = 0.58) albeit still higher than R = 0.5; and this means that the primary quality of the team players has some influence on the team success.
Let us consider the above Case B in more detail: see Figure 2. The coordinate system is separated by the regression line in the following two differently coloured parts.
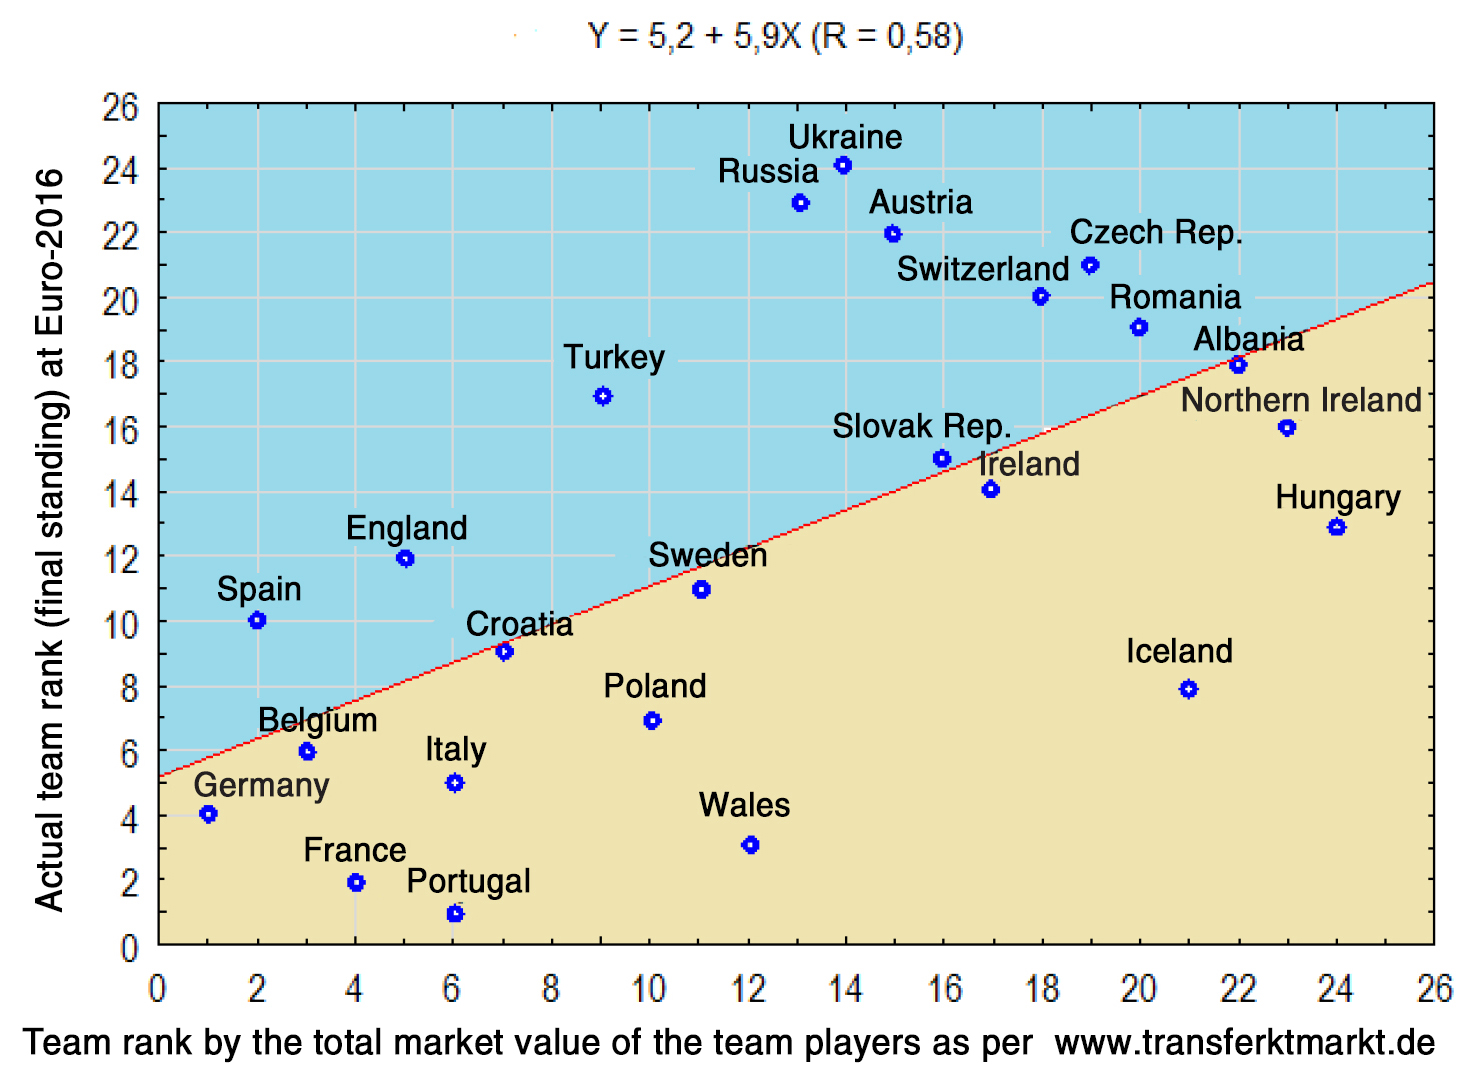
Figure 2. Breakdown of the Euro-2016 competitors into two groups
Lower (yellow) field on Figure 2 is the area for the teams that performed better than could be expected at Euro-2016; and the upper (blue) field on Figure 2 is the area for the teams that either totally failed or performed worse than expected based on the total market values of their players. Given on Figure 3 hereunder is the chart showing how the team ratings by the success/ failure degrees may be made. The distance of the actual team standing point from the approximating line (of ideally expected positions) shows how far the actual team performance in the tournament was from its statistically expected success rate.

Figure 3. The scheme showing how the team success/ failure at Euro-2016 was rated
The above rating system may be applied to rate performance of every Euro-2016 competitor (24 teams in total). We split up the teams into the following five groups by the performance rates: see Table 2.
Table 2. The Euro-2016 competitors’ success ratings
|
Team performances rated versus the expectations/ forecasts based on the total market values of the team players |
||||
|
Performed much better than expected |
Performed little better than expected |
Performed as expected |
Performed slightly worse than expected |
Performed much worse than expected |
|
1. Iceland |
8. Northern Ireland |
12. Switzerland |
16. Romania |
21. Turkey |
|
2. Wales |
9. Germany |
13. Croatia |
17. Sweden |
22. Austria |
|
3. Portugal |
10. Ireland |
14. Albania |
18. England |
23. Russia |
|
4. Hungary |
11. Belgium |
15. Slovak Rep. |
19. Czech Rep. |
24. Ukraine |
|
5. France |
|
|
20. Spain |
|
|
6. Poland |
|
|
|
|
|
7. Italy |
|
|
|
|
The study data given in Table 2 may be helpful in the efforts to analyse the final team standings after Euro-2016 and formalise the subjective impressions of the specialists and fans.
Afterword
The recent loss of the Russian national team to Qatar (currently ranked 93 on the FIFA list) in match of 10.11.16 with the score of 1:2 [4] shows once again that the team performance has not much improved since Euro-2106.
Conclusion. It was Iceland and Wales that were the most successful at the 2016 UEFA European Championship and may be considered the heroes of the event as their performance rates generated by the study are even better than those of Portugal, Hungary, Poland, Northern Ireland and Ireland. These teams performed notably better than expected based on the total market value of the team players. The lower field of the rating chart generated by the study is somewhat similar to the actual team standings, with the national teams of Ukraine, Russia, Austria and Turkey showing the worst performance rates.
On the whole, the study data and analyses give the reasons to state that the players’ quality ratings (including the current market values of the team players) in team sports in general and football in particular may not always be used as a sound predictor of a final competitive success. Teams with relatively low total market values of the team players may perform quite successfully in top-ranking competitions when fully mobilise many other contributors to the competitive success including prudent game strategies, high determination, good teamwork and strong team spirit.
References
- Dunayev V. O rangovykh raspredeleniyakh v klassifikatsii [On rank distributions in classification]. Available at: http://dunaevv1.narod.ru/classrunk.htm. (Accessed: 7/31/2016)
- Rabiner I. Futbol. Tovarischeskiy match Katar – Rossiya - 2:1. Nedosbornaya [Football. Friendly Match Qatar - Russia - 2:1. Underteam]. Available at:: www.sport-express.ru/newspaper/. (Accessed: 11/11/2016)
- Reyting sbornykh Evro-2016 po stoimosti sostava [Euro-2016 national teams ranking by team cost]. Available at: http://sport.bigmir.net/ch/euro2016/1765885-Top-sbornyh-Euro-2016-po-stoimosti-sostava#comments. (Accessed: 7/25/2016)
- Futbol. Itogi Euro-2016. 24 sbornye: vse kto igral [Football. Euro-2016 results. 24 national teams: all teams]. Available at: http://www.sport-express.ru/newspaper/2016-07-18/8_1// (Accessed: 7/25/2016)
Corresponding author: ArtIgPetrov@yandex.ru
Abstract
Chances of the Russian national football team prior to the Euro-2016 Championship were rated very optimistic by the expert community for the reason that the team was ranked number one in the qualification tournament where it competed with high-ranking teams and reached the final under leadership of the chief coach much respected by the experts as a gifted top-professional with innovative views. However, the actual competitive success of the Russian national football team at Euro-2016 was unexpectedly poor with its 23rd place in the team standing table of 24 team competitors of the Championship and with only one point of possible nine scored in the group matches.
A final competitive success is known to be dependent on a variety of factors which contributions cannot always be predicted fairly accurate. Furthermore, it is not unusual that a positive synergic effect of multiple contributors often gives a boost to the team and helps it come up much higher in the rankings than could be expected based on any reasonable calculation. Mentioned first among these potential contributors should be the quality of coaching services, success of the teamwork and team spirit building efforts, determination of the players for success; their physical fitness levels and many other things. One of these contributors – that is the total market value of the national team players – may still be rated fairly accurate and this rate may in fact be viewed as a consolidated multisided expert measure of the players’ professional mastery levels and potential contributions to the potential team success. The article considers the competitive success rates of the national football teams in Euro-2016 versus the total market values of their players as provided by www.transferktmarkt.de.


 Журнал "THEORY AND PRACTICE