Analysis of world records in track running events in context of bioenergetic processes
Фотографии:

ˑ:
Associate Professor, Dr.Hab. S.N. Litvinenko
L.A. Golikov
I.M. Lyatina
A.A. Mitrofanov
A.D. Petrov
Russian State University of Physical Culture, Sport, Youth and Tourism (GTsOLIFK), Moscow
Keywords: world records, bio-energy processes, human capacity limits, competitive sports, track running events
Background. Record accomplishments crown athletic careers in elite sports and this is the prime reason for interest of many researchers to a variety of the record data analysis. The study by O.I. Popov, for instance [3], reports a mathematical analytical methodology to produce a logarithmic formula of the world records variations in competitive swimming events for the XX century. I.A. Grets in his thesis [2] considers in detail the gender-specific variations of record accomplishments and identifies the major determinants of top results in sports. Article by Andrew Murray and Ricardo JS Costa [5] analyzes the physiological and bio-energetic aspects of world records in ultra-marathons since the year of 1928. The authors found the trained human body showing at times such unusual “superhuman” abilities in adapting to draining mid-intensity loads that one cannot but wonder if there is any limit for the human capabilities.
South-Korean researchers Yu Sang Chang and Seung Gin Baek [4], having analyzed and benchmarked the world records history in 29 track and field disciplines and 32 swimming disciplines, came up with a few groups of records classified by the improvement rates. The authors came to conclusion that the mankind came to the limit of its natural abilities vertically in every sport discipline, stating the following: “In conclusion, improvement in running and swimming appears to slow down eventually due to the existence of maximum limit» [4, p. 107].
It should be noted that, notwithstanding the obvious and high interest of the researchers, the matters of bio-energy provisions for the progress of world records are still poorly addressed by the modern sport science.
Objective of the study was to find regularities in the world records in the track running events in the context of the leading bio-energy generating processes including creatine phosphate, glycolytic, mixed aerobic-anaerobic and aerobic ones.
Methods and structure of the study. The study was based on a retrospective analysis of the world record data formally registered by the IAAF for men and women in 12 track running events since 01.01.1975 (the electronic registration system launching date). Subject to the analysis were 232 world records including 113 men’s and 119 women’s ones. Each of the records was substantiated by the following indices: (1) record growth time (G), i.e. time improvement in the relevant distance running even versus the last record, in seconds; and (2) inter-record period (RP) meaning the number of days from one formal world record date to the other, i.e. the record keeping time. The track running events were split up into the relevant bio-energetic groups based on the sport exercise classification by N.I. Volkov [1]. Statistical data analysis was performed using the standard Microsoft Office Excel and STATISTICA 10.0 toolkits.
Study results and discussion. The mean values, mean square deviation (MSD) rates and the Pearson’s correlation coefficients (CC) for the G and RP are given hereunder in Table 1. As one can see from Table 1 data, the highest positive correlation of G and RP is found for the men’s 1609 m race event, with no significant correlations found for the other events.
Table 1. World records in track running events: primary analytical data
|
Bio-energy groups |
Event |
Sex |
Inter-record period (RP), days |
Record growth (G), seconds |
Count |
Pearson’s correlation coefficient for RP vs. P |
||
|
Mean, days |
MSD |
Mean, s
|
MSD |
|||||
|
Creatine phosphate (КР) |
100 |
m |
1243,0 |
1459,5 |
0,03 |
0,03 |
12 |
-0,28 |
|
w |
828,0 |
829,2 |
0,08 |
0,09 |
7 |
0,34 |
||
|
110h |
m |
1623,3 |
1429,0 |
0,05 |
0,05 |
9 |
-0,49 |
|
|
w |
832,1 |
953,1 |
0,05 |
0,05 |
7 |
0,17 |
||
|
200 |
m |
2983,6 |
2666,1 |
0,13 |
0,12 |
5 |
- |
|
|
w |
652,7 |
696,1 |
0,11 |
0,12 |
8 |
-0,38 |
||
|
Glykolytic (GL) |
400 |
m |
5634,5 |
2274,8 |
0,34 |
0,33 |
2 |
- |
|
w |
368,1 |
388,3 |
0,23 |
0,16 |
11 |
0,42 |
||
|
400h |
m |
1455,6 |
1085,6 |
0,21 |
0,08 |
5 |
- |
|
|
w |
707,8 |
891,5 |
0,28 |
0,19 |
15 |
0,04 |
||
|
800 |
m |
1317,3 |
2141,4 |
0,26 |
0,36 |
10 |
-0,29 |
|
|
w |
905,7 |
595,5 |
1,05 |
1,17 |
4 |
- |
||
|
Mixed aerobic-anaerobic (Mx) |
1500 |
m |
992,0 |
860,8 |
0,68 |
0,52 |
9 |
-0,03 |
|
w |
3130,2 |
3227,7 |
2,27 |
1,94 |
5 |
- |
||
|
1609 |
m |
1091,2 |
1081,2 |
0,78 |
0,64 |
8 |
0,78 |
|
|
w |
934,1 |
783,3 |
1,88 |
1,72 |
9 |
0,45 |
||
|
3000h |
m |
1184,1 |
1167,6 |
1,80 |
1,35 |
9 |
-0,55 |
|
|
w |
300,1 |
389,7 |
5,73 |
2,31 |
15 |
-0,13 |
||
|
Aerobic (AE) |
5000 |
m |
755,9 |
809,2 |
2,73 |
2,95 |
13 |
-0,29 |
|
w |
751,0 |
982,6 |
4,87 |
3,87 |
13 |
-0,25 |
||
|
10 000 |
m |
734,5 |
815,8 |
5,21 |
3,06 |
14 |
-0,08 |
|
|
w |
542,7 |
850,4 |
20,68 |
19,40 |
8 |
0,50 |
||
|
42 195 |
m |
921,8 |
965,2 |
24,69 |
15,46 |
13 |
0,30 |
|
|
w |
717,5 |
1190,7 |
98,17 |
80,45 |
14 |
-0,32 |
||
In the glycolytic group, analysis of the intra-group correlation coefficients found the significant CC between the RP indices for the women’s 400 m runs and 400 m hurdles (0.88); plus mean-level correlations were found in G indices for the same women’s events (0.56). The most significant CC were found for the mixed aerobic-anaerobic energy group (see Table 2), with the mean correlations of the G values found for the men’s 1500 m and 1609 m events (0.55).
Table 2. Significant Pearson’s correlation coefficients for the record growth times (G)
|
Distance, women |
1500 m |
1609 m |
3000 m hurdles |
1609 m |
|
1500 m |
1,00 |
0,85 |
0,80 |
- |
|
1609 m |
- |
1,00 |
0,91 |
0,79 |
The intergroup correlation coefficients for the RP values are given hereunder in Table 3. Please note the negative CC for the men’s 1609 m and 100 m RP (-0.71), i.e. the shorter is the inter-record period (RP) in the mile races, the longer are the inter-record periods in the 100 m sprints, and vice versa.
Table 3. Intergroup Pearson’s correlation coefficients for the inter-record periods (RP)
|
Track running events matched |
CC |
Bio-energy groups |
|
Men’s 1609 m and 100 m |
-0,71 |
Mx vs. KP |
|
Women’s 1609 m race and 400 m hurdles |
0,82 |
Mx vs. Gl |
|
Women’s 3000 m hurdles and 400 m hurdles |
0,76 |
Mx vs. Gl |
|
Men’s 1609 m and 10,000 m |
0,75 |
Mx vs. AE |
Cluster analysis of the RP data shows the RP correlations for different track running events being generally chaotic. Variations of the numbers of the formal world records by the 12 Olympic cycles are given hereunder on Figure 1.
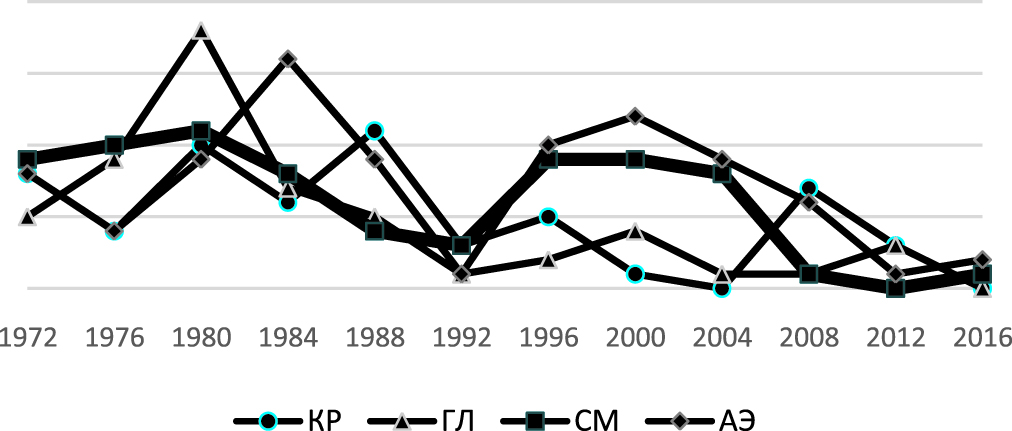
Figure 1. Numbers of world records by Olympic cycles
The data presented on above Figure 1 gives reasons to conclude that the world records in every bio-energy group showed some declines following the 1980/1984 Olympics, with the particularly expressed sag in the period of 1989-1992, i.e. the preparatory period for the Olympics in Barcelona. It was followed by the growth period of world record counts and then by the next sag after 2008.
It is a common knowledge that the mixed aerobic-anaerobic energy group prevailing in 1500 m, 1609 m and 3000 m hurdles [1] is to be mobilized by multisided training practices. The study data and analyses show that the top accomplishments of athletes in the mixed-zone events show negative correlations with the creatine phosphate energy generating mechanism, albeit the close correlations with the glycolytic and aerobic energy supply processes. It may be recommended that the coaching teams should be more accurate in selecting the training methods and tools in the 400 m hurdles and long distances to improve the athletes' workability rates in the aerobic-anaerobic energy zone. And on the contrary, the aerobic and glycolytic energy sources prevailing in the competitive practices may require a mixed-zone-mobilizing training methods and tools to improve the maximum distance speed rates and speed-endurance rates, respectively.
It should be noted that, from the viewpoint of sport bioenergetics [1], the mixed-zone loads are highly demanding to the power and capacity of the aerobic and anaerobic energy supply systems. Efforts to improve these rates secures positive bio-energetic adaptation shifts in the training process potentially beneficial for the competitive progress of the athletes and, hence, improvements of the world records.
Conclusions. The study found the mixed aerobic-anaerobic energy group of the track running events (the men’s and women’s 1500 m, 1609 m and 3000 m hurdles as we grouped for the study) showing the most correlated structure of the world records. This group shows the most close and versatile correlations between the record growth times and inter-record periods, whilst the world records in the other bio-energy groups (creatine phosphate, glycolytic and aerobic) were found to be largely unexpected and unconnected.
The notable growth of the competitive accomplishments and high specializations of athletes in the last few years apparently require the applied training methods and tools being further perfected and detailed to ensure high quality training systems for elite athletes in the mixed aerobic-anaerobic energy supply zone.
References
- Volkov N.I. Biokhimiya myshechnoy deyatel'nosti (Biochemistry of muscle activity) / N.I. Volkov, E.N. Nesen, A.A. Osipenko, S.N. Korsun. – Kiev: Olimpiyskaya literatura, 2013. – 504 p.
- Grets I.A. Rekordnye sportivnye dostizheniya zhenshchin v aspekte polovogo dimorfizma: avtoref. dis. ... dokt. ped. nauk (Record sport achievements of women in context of sexual dimorphism: Abstract of doctoral thesis (Hab.). – St. Petersburg, 2012. – 52 p.
- Popov O.I. Ergometricheskiy analiz dinamiki mirovykh rekordov v sportivnom plavanii na protyazhenii XX veka (Ergometric analysis of world swimming records dynamics during the XX century) / O.I. Popov // Jubilee proceedings of RSAPC scientists dedicated to the 80th anniversary of the Academy. – Moscow, 1997. – V. 1. – P. 129-136.
- Chang Yu Sang and Baek, Seung-Jin. Limit to Improvement in Running and Swimming // Int. J. Applied Management Science, 2011, Vol. 3. - Рp. 97-120.
- Murray Andrew and Costa, Ricardo JS. Born to run. Studying the limits of human performance: Advances in Sport Nutrition, Exercise and Medicine. – 2012. – URL: http://www.biomedcentral.com/1741-7015/10/76
Corresponding author: alex@boberza.com
Abstract
The study was designed to apply a set of mathematical statistics methods to find regularities in the world records in the track running events in the context of leading bio-energy supply processes including creatine phosphate, glycolytic, mixed aerobic-anaerobic and aerobic ones. The world records in 12 track running events (232 records in total) formally registered by IAAF since 1975 were used for the purposes of the retrospective analysis under the study. The study found that it is the mixed aerobic-anaerobic energy supply group including 1500m, 1609m and 3000m hurdles that shows the most consistent structure of the world records. This group reveals the tightest and most versatile connections between different world record indices, whilst the world records in the other bio-energy groups were found less predictable.


 Журнал "THEORY AND PRACTICE