Quantitative assessment of level of competition among tennis professionals
Фотографии:

ˑ:
PhD, Associate Professor, Rector’s Advisor G.V. Danilov
Head of Information Systems for Economy Laboratory K.V. Rochev
Ukhta State Technical University, Ukhta, Russian Federation
Keywords: tennis, ATP ranking, WTA ranking, competition, intensity of competition
Introduction
All living organisms exist in the face of a fierce competition which enables the strongest to survive, to produce offspring that is genetically better suited to fight for their "place under the sun", and this entire process is a prevailing source of evolution. The rivalry between people is determined by their professional sphere, political involvement, sport and intellectual competitions, economic and financial interests, and many other aspects of the multifaceted range of human activities.
Usually competition results are presented as a modified list of participants that is ranked according to some quantitative or qualitative attributes (ratings). Since as a rule these lists contain tens, hundreds, and sometimes thousands of members, it becomes impossible for the "mere mortals" (yes, perhaps even for the experts) to catch all the nuances of competition between all of the members, more so because usually these nuances do not lie on the surface. There is a need for a special assessment procedure.
Materials and methods.
[1] contains a description of the method for measuring growth in competition level intensity regardless of the nature of a competition with the use of a fairly large number of formulas that reflect various components of the competition. Below is the essence of this technique with virtually no application of the formulas through an example in sports, a tennis competition example to be exact.
As is well known, there are lists compiled for all tennis professionals in which each athlete has a definite place in accordance with the points he/she scored (so-called "roster"), and these lists are regularly updated (modified). We are talking about the ATP for men and WTA rankings for women. Those ratings also identify a top layer, the "top chart", which promises significant advantages and benefits of both material and moral terms to the individuals who make it.
For terminological unanimity sake we are going to call the top layer the "Head" of the appropriate length n, and the rest of the ranked list would be the "Tail" of length N - n (N is the total number of athletes listed). Thus, in top 10 the Head has a length n = 10, and if the list contains 1000 athletes, the length of its Tail is 1000 - 10 = 990.
It is clear that the higher the intensity of the competition, the more intense becomes the overall modification of the list. However, in assessing of competition we must also take into account the psychological attitude of any mature tennis player, his/her “ultimate goal” of moving from Tail to Head. Thus, any move of any individual(s) within the list from the Tail to the Head and from the Head to the Tail will be called "Vertical Competition" (VC). Using a biological metaphor we can describe it as an "intraspecific" competition. Any other move (which does not cross the "head-tail" border) would be called "Horizontal Competition" (HA), or an "intraspecific" competition. For further discussion it will be convenient to call the following elements in the list:
1) Risen from Tail to Head - strong tail elements
2) Dropped from Head to Tail - weak head elements
3) Remained within the Head - strong head elements
4) Remained within the Tail - weak tail elements
Mutual movement of elements within each of these groups will be called correlative mixing; their combined mixing in our terms - Horizontal Competition.
As we can see, competition has many nuances (factors, components), and if we want to quantify each of them (and that's what we intend to do below), it is necessary to agree on how to proceed with calculations.
To assess vertical displacement, it is necessary to find the difference in the place that was held in the previous and the following cycles for each of the new elements of the Head and to sum up these differences for all these new elements (let them be k). This difference will be called a Rising Height of the strong Tail elements to Head (RHH). The exact same way the Depth of the Drop of the weak Head elements to Tail (DDT) is determined.
Note 1. It assumed, charts only indicate places that were taken by the participants (points are not presented).
To correctly evaluate the Intensity of Raising to Head (IRH) and Dropping to Tail (IDT) processes, RHH and DDT must be normalized with their most possible (theoretically) values, which are as shown in [1] must be the same and equal to n (N-n), and Vertical Competition Intensity (VCI) would be a simple arithmetic mean: VCI =
To determine the amount of Horizontal Competition Intensity (HCI), first you must find the mixing value of each of the four above-mentioned types of items calculated by comparing the sequence number of successive elements of this type in the previous cycle with an estimated sequence number of the same elements in the next cycle. The sum of differences of these elements’ places taken in absolute value will be the mixing value of the appropriate type of elements. Mixing intensity in each group of elements is the optimal (theoretically) normalizing value of a corresponding mix, which has an inverted list in relation to the original. It can seen [4] that the normalizing value for the segment of the natural numbers of length m, is equal to m²/2 for an even m and (m²-1)/2 for an odd m.
Note 2. Elements’ sequence order is obtained from its natural (original) by "compression" of it to the corresponding natural segment numbers.
Finally, the integral index is the Intensity of Competition (IC). In this given community it is calculated using the formula derived in [1] (due to its cumbersomeness, we do not show it here); it is important to emphasize that in accordance with this formula IC=100% only if as a result of fierce competition the original list completely "turns over" (never possible in practice) and becomes inversed [5].
Thus, the multifaceted process of competition gets organized and enables us to analyze the nature of competition in various aspects and to compare results of competition analysis in different communities of different time periods.
The described computational process is best comprehended on a real example.
Results and their Discussion
Example. Using WTA Women's Tennis Association rankings of two dates, 16.01.2012 and 14.01.2013, we must calculate all of competitive components for tennis players for the 2012-2013 period.
Note 3: For calculation demonstration purposes and their simplification we shall use lists containing the first 200 athletes only; moreover, these lists, after excluding those who are not included in both lists, are reduced to N=152. In addition, considering the limited size of the article, we shall work only with fragments of lists necessary to explain the details of calculations.
16.01.2012 14.01.2013
1. Voznyatsky K. 1. Azarenko V.
2. Kvitova P. 2. Sharapova M.
3. Azarenko V. 3. Williams S.
4. Sharapova M. 4. Radvanska A.
5. Stosur S. 5. Kerger A.
6. Li Na 6. Li Na
7. Zvonareva V. 7. Errani S.
8. Radvanska A. 8. Kvitova P.
9. Bartoly M. 9. Stosur S.
10. Petkovic A. 10. Voznyatsky K.
-----------------------------------------------------------------------------------------
11.Skyavone F. 11. Bartoly M.
12. Williams S. 12. Petrova N.
29. Kerber A. 92. Zvonareva V.
47. Errani S. 141. Petkovic A.
Assume the length of the head is n=10 (top 10).
Calculation of vertical competition
As seen from the above fragment of WTA rankings for the period under review, three players have risen from the Tail to the Head (k=3): S. Williams, A. Kerber, and S. Errani. Therefore, PUH (Percentage Updates to Head) = 100*k/n% = 30%. These tennis players moved up by 9, 24, and 40 points respectively; this means that RHH = 9+24+40 = 73.
Three of them (V. Zvonareva, M. Bartoli, and A. Petkovich) have dropped from the Head to the Tail, dropping by 85, 2, and 131 points respectively, which means DDT = 85+2+131 = 218. The RTH = 100*73/(10*(152-10))% = 5,14%. IDT = 100*218/(10*(152-10))% = 15,35%. IVC = (5,14 + 15,35)/2 = 10,25%.
Note 4. Thus, the IVC is approximately three times less (in this example) than PUH; this is due to the fact that the IVC, unlike PUH, takes into account not only the number of new elements in the Head, but also where these new elements came from to the Head and where they placed in it, as well as which Head elements dropped to the Tail and where they placed there.
Calculation of horizontal competition
MITH = 0.00% (this is quite obvious, as the three tennis players, who got from the Tail to the Head, do not change each other’s order); To calculate MIHT, first we enumerate those three who dropped to the Tail through compression: 1. V. Zvonareva, 2. M. Bartoli, 3. A. Petkovich. Their corresponding order in the Tail: 2, 1, 3. The sum of absolute differences is |1-2| + |2-1| + |3-3| = 2; we divide it by the maximum possible amount, equals to (32 -1)/2 = 4. As a result, we have MIHT = 100 * 2/4% = 50%. Similarly, to calculate MIHH we enumerate those who stayed in the Head: 1. C. Wozniacki 2. P. Kvitova 3. V. Azarenka 4. M. Sharapova 5. S. Stosur 6. Li Na 7. A. Radwanska. The following year, they took the (renumbered) places 7, 5, 1, 2, 6, 4, 3. The sum of absolute differences |7-1| + |5-2| + |1-3| + |2-4| + |6-5| + |4-6| +|3-7| = 20; We divide it by the maximum amount possible (72-1)/2 = 24 and get MIHH = 100*20/24% = 83.33%. Same way we calculate MITT = 42.13%. (This article’s volume does not allow inclusion of all of the athletes in the Tail). Further, MIAH = (3*0 + (10-3)*83,33)/10 = 58,33%. MIAT = (3*50 + (152 – 10 – 3)*42,13)/(152 – 10) = 42,30%. Finally, HCI = (10*58,33 + (152 – 10)*42,30)/152 = 43,35%.
Interestingly, we can note that the HCI is four times the VCI, which has an obvious explanation: it is much harder to replace leaders than to "hanging out" in their immediate vicinity. Especially vigorous mixing (the competition for a higher place) can be observed in a group that has been leading both seasons: MIHH = 83.33% - is twice as high as MITT.
An integral component is IC = 38.09%.
Note 5: The intensity of competition in cases where the participants are not listed according to placement, but rather by points scored is calculated in the same manner as that described above, but the formulas are much more cumbersome (see [1]).
It is interesting to trace the dynamics of competitiveness going many years back in both female and male Tennis Professionals environments.
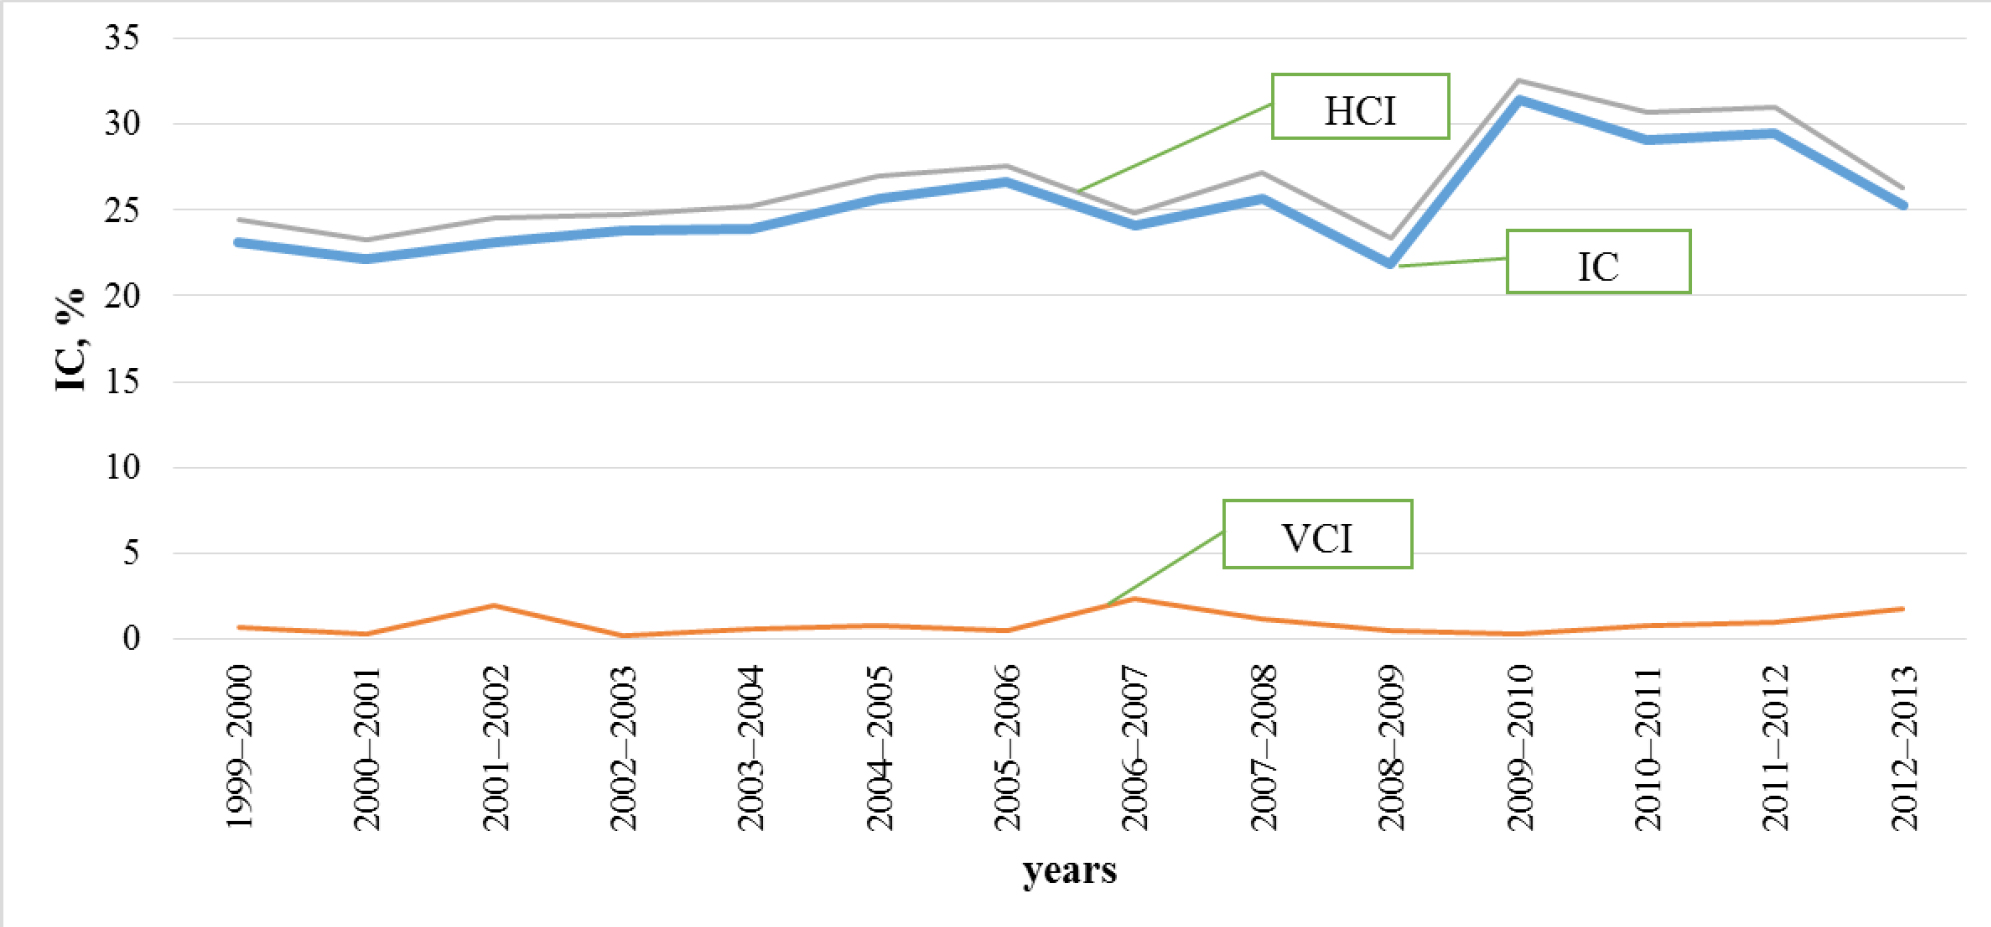
Fig. 1. Female tennis players competitiveness, calculated based on WTA ratings (for n = 10)
As we can see, the intensity of competition among female tennis players for many years has fluctuated around an average of (CBI = 25); in 2009-2010 it has experienced a significant jump decreasing in subsequent years to its "usual" level.
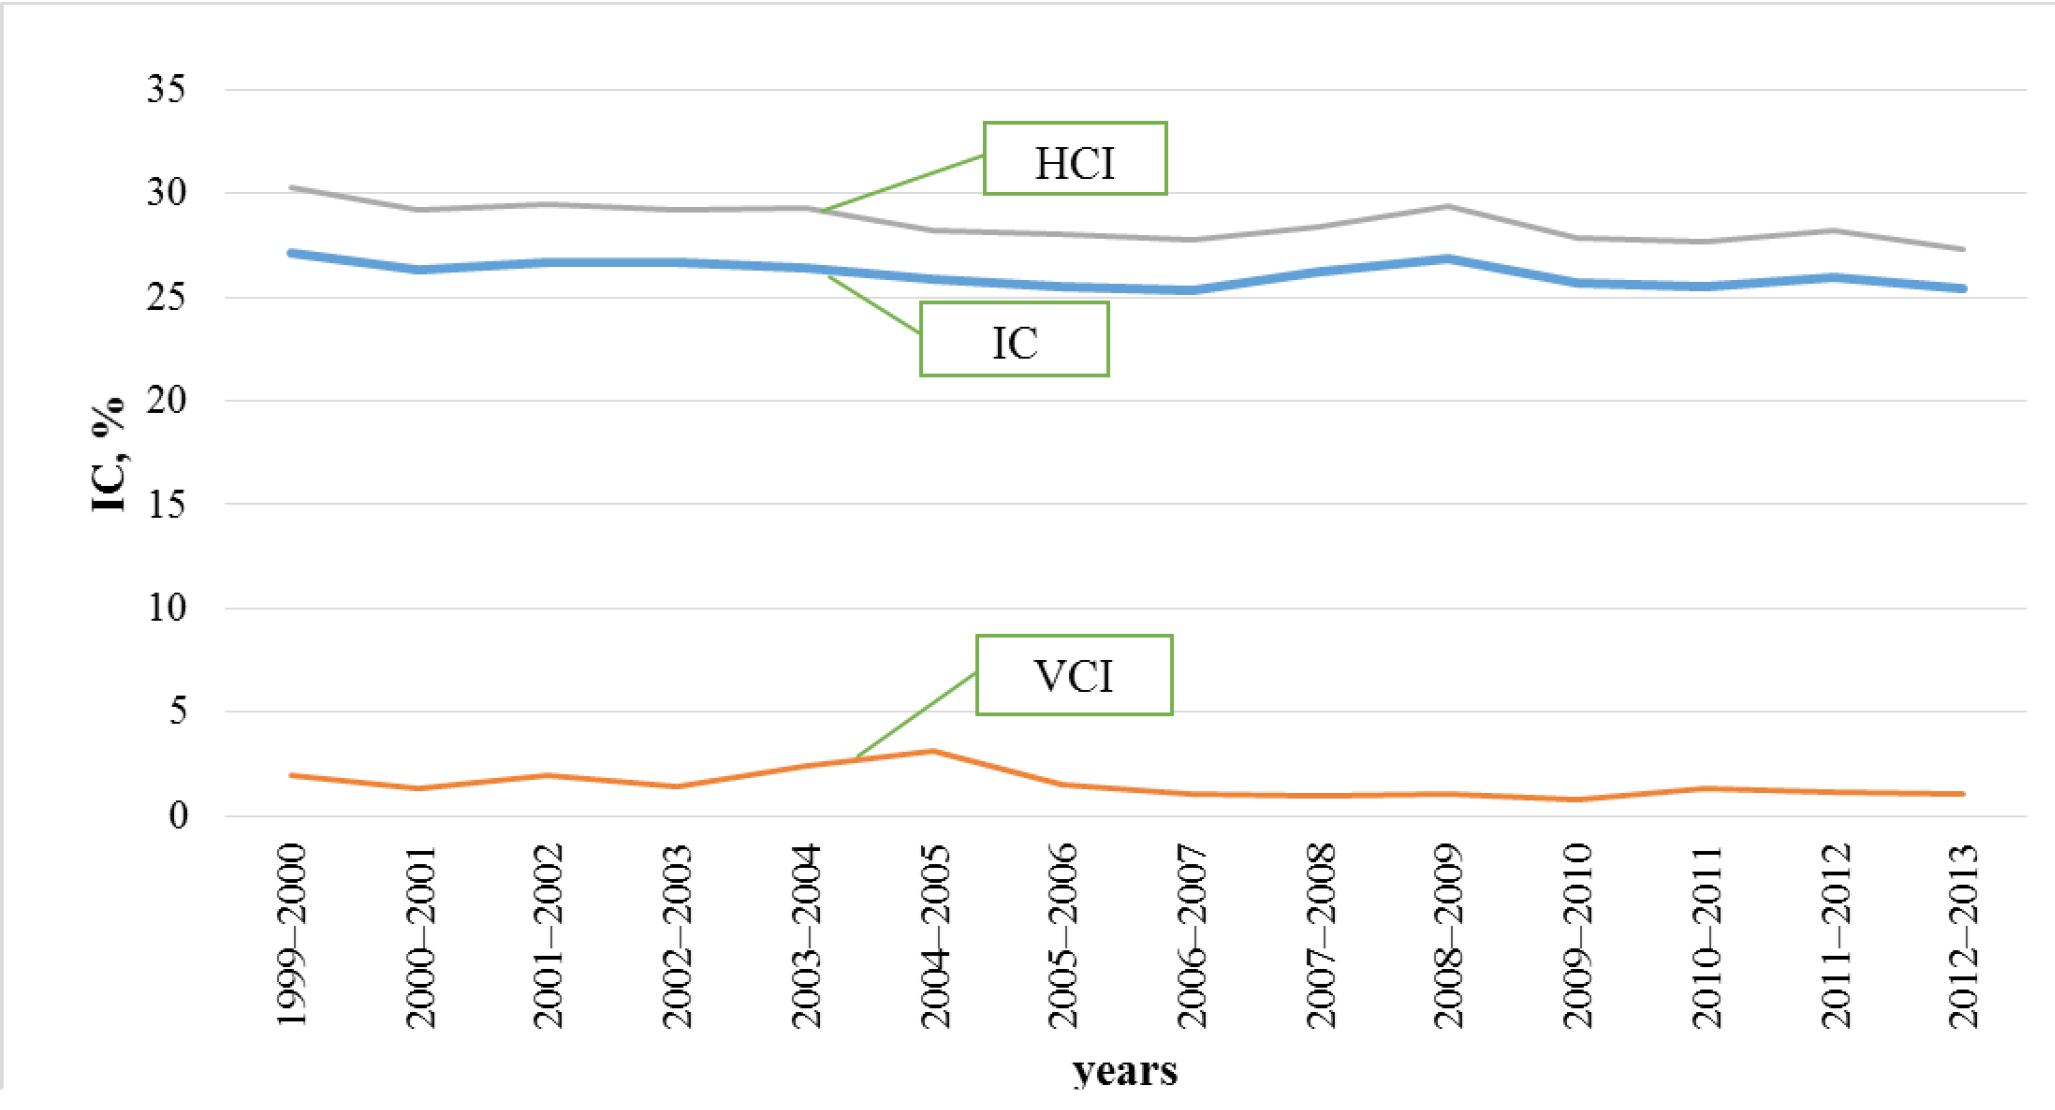
Fig. 2. Male tennis players’ competitiveness, calculated based on the ATP rankings (if n = 30)
Fig. 2 shows that male players’ intensity of competition is quite stable and the average is about the same (CBI = 26) as for female players.
Competition scale
Normally it is difficult to assess the intensity of competition measured in percent in different situations and under different conditions for an uninitiated person. If there were an arbitrary scale, similar to that used in the assessing of the wind strength, the Beaufort scale, which would devide all of the theoretically possible range of rivalry into few easy to remember sub-bands, than the task of "visual" assessment of competition would be significantly simpler. In this regard, we propose the following scale for intensity of competition - IC (composed as a subset of the Beaufort scale)
Competition levels:
1. Calm (0 ≤ IC ≤ 10%)
2. Weak (10% < IC ≤ 20%)
3. Moderate (20% < IC ≤ 40%)
4. Strong (40% < IC ≤ 60%)
5. Storm (60% < IC ≤ 80%)
6. Hurricane (80% < IC ≤ 100%)
Using this classification, we can say that the overall level of competition among tennis professionals, both women and men, is moderate; while in the top layer’s level is strong.
Conclusion
The author's quantifying method of competition above allows to "sort through" the entire multifaceted, complex process of rivalry between athletes of a particular sport (in this case it is tennis) when a fairly narrowed down top layer of the rating is artificially allocated by scrupulous account of all the nuances of vertical and horizontal components of this rivalry.
References
- Danilov G.V., Rochev K.V. Metodika dinamicheskoy otsenki intensivnosti konkurentnoy bor'by Dynamic assessment of competition intensity technique // Upravlenie ekonomicheskimi sistemami (Management of economic systems: an online scientific journal). N01. 2013. URL: http://uecs.ru/index.php?option=com_flexicontent&view=items&id=2004.
- Ofitsial'ny sayt WTA / Odinochnye reytingi (The official WTA website / singles ranking) [online source]. URL: http://www.wtatennis.com/singles-rankings.
- Ofitsial'ny sayt ATP / Odinochnye reytingi (The official ATP website / singles ranking) [online source]. URL: http://www.atpworldtour.com/Rankings/Singles.aspx.
- Problemy razvitiya ekonomiki i obshchestva: monografiya (Economy and society development problems: monograph) / Ermolina M.A., Kiryanov I.V., Kochegarova E.D., et al. Saint-Louis, MO: Publishing House «Science & Innovation Center», 2013. 256 p.
- Sovremennoe sostoyanie i puti razvitiya ekonomiki sovremennosti (Current state and development of modern economy) / Berdina M.Yu., Bigdan O.V., Bosovskaya M. ., et al. Odessa: Kuprienko NE, 2013.181p.
Corresponding author: danilov@ugtu.net
Abstract
The article describes the author's method of quantifying the level of competition in sports such as tennis. Assessment of competition level intensity is based on ATP rankings for men and WTA rankings for women from 1999 to 2013 data. It takes into account the intensity of competitive sports skills associated with striving to make it to the top rankings, as well as making it into the "mix" in these ratings. The level of competition is estimated as 26% of the maximum possible ("moderate" on the scale of competition introduced by the authors). A slight decrease in the intensity of competition in the rating of the best tennis players in the last 14 years is noted; although, the level of such competition in general is much higher than 26% and can be described as "strong".


 Журнал "THEORY AND PRACTICE