Correlation of Sports Result at Distances of Classic Men’s Allround Speed Skiing
Фотографии:
ˑ:
A.G. Polozkov, professor, Ph.D.
Russian Customs Academy, Moscow
G.A. Polozkov
Moscow
Keywords: speed skating, cluster analysis, regression, forecasting.
Introduction. Problems of special training in classic all-around speed skating are extremely relevant. European and World Championships and Olympic Games are the most prestigious competitions. Basically athletes who had gone through allround training won the Olympics. One can find in the modern scientific and methodical literature a significant amount of research devoted to the problems of the theory and methodology of sports training of speed skaters, however, the dependence of athletic performance at distances in men's classic all-round speed skating has been studied insufficiently [1-3].
The purpose of the study was to identify the relationship of men's athletic performance at classic all-round speed skating distances.
Materials and methods. The statistical data of speed skating results were borrowed from official reference books, as well as from the online database "Speed skating. Statistics" and "ISU.org". The results of world champions in speed skating in the period from 1908 to 2013 were subject to a comparative analysis.
Results and discussion. The statistical data were processed using the author software by B.G. Mirkin (1985). The method of cluster analysis was applied to identify a more close relationship of athletic performance at all-round speed skating distances. The study revealed several homogeneous groups of athletes. A linear dependence between the results at classic all-around distances, described by the regression equation, was detected in the group, which included such outstanding speed skaters as Ard Schenk, Eric Heiden, Nikolay Gulyayev. The coefficient of correlation between the indices equals 0.99.
The regression equation is as follows Y=a*Т+b
Where, Y- base index, a and b – regression coefficient.
Т - sports result at the distance in seconds.
|
№ |
Y (sec) |
A |
B |
Т at the distance (sec) |
|
1) |
Т1500 |
3.7 |
-25.12 |
Т500 |
|
2) |
Т5000 |
13.32 |
-86.4 |
Т500 |
|
3) |
Т10000 |
1.79 |
132.4 |
Т5000 |
|
4) |
Total of points |
4.7583 |
-18.3936 |
Т500 |
Table 1. Results of world champions in classic all-round
|
|
Year |
First name, last name |
Country |
500m |
5000 m |
1500m |
10000m |
Total of points |
|
1 |
1938 |
Ivar Ballangrud |
Norway |
43.8 |
08:20.2 |
02:16.1 |
17:14.4 |
190.907 |
|
2 |
1946 |
Odd Lundberg |
Norway |
45.2 |
08:34.0 |
02:21.0 |
17:29.7 |
196.085 |
|
3 |
1947 |
Lassi Parkkinen |
Finland |
45.2 |
08:33.7 |
02:22.1 |
17:38.7 |
196.872 |
|
4 |
1970 |
Ard Schenk |
Netherlands |
40.3 |
07:30.7 |
02:04.4 |
15:33.0 |
173.487 |
|
5 |
1975 |
Harm Kuipers |
Netherlands |
40.99 |
07:35.6 |
02:05.88 |
15:49.85 |
176.002 |
|
6 |
1979 |
Eric Heiden |
USA |
38.22 |
06:59.15 |
01:56.05 |
14:43.11 |
162.973 |
|
7 |
1987 |
Nikolay Gulyayev |
USSR |
37.24 |
06:51.28 |
01:52.70 |
14:28.50 |
159.356 |
Тable 2. Estimated results at 1500m, 5000m, 10000m distances in seconds and the total of points in classic all-round
|
Year |
First name, last name |
1500m |
5000m |
10000m |
Total of points |
|
1938 |
Ivar Ballangrud |
136.94 |
497.02 |
1027.76 |
190.006 |
|
1946 |
Odd Lundberg |
142.12 |
515.66 |
1052.46 |
196.668 |
|
1947 |
Lassi Parkkinen |
142.12 |
515.66 |
1051.92 |
196.667 |
|
1970 |
Ard Schenk |
123.99 |
450.40 |
939.15 |
173.353 |
|
1975 |
Harm Kuipers |
126.543 |
459.59 |
947.91 |
176.636 |
|
1979 |
Eric Heiden |
116.294 |
422.69 |
882.68 |
163.457 |
|
1987 |
Nikolay Gulyayev |
112.668 |
409.64 |
868.59 |
158.794 |
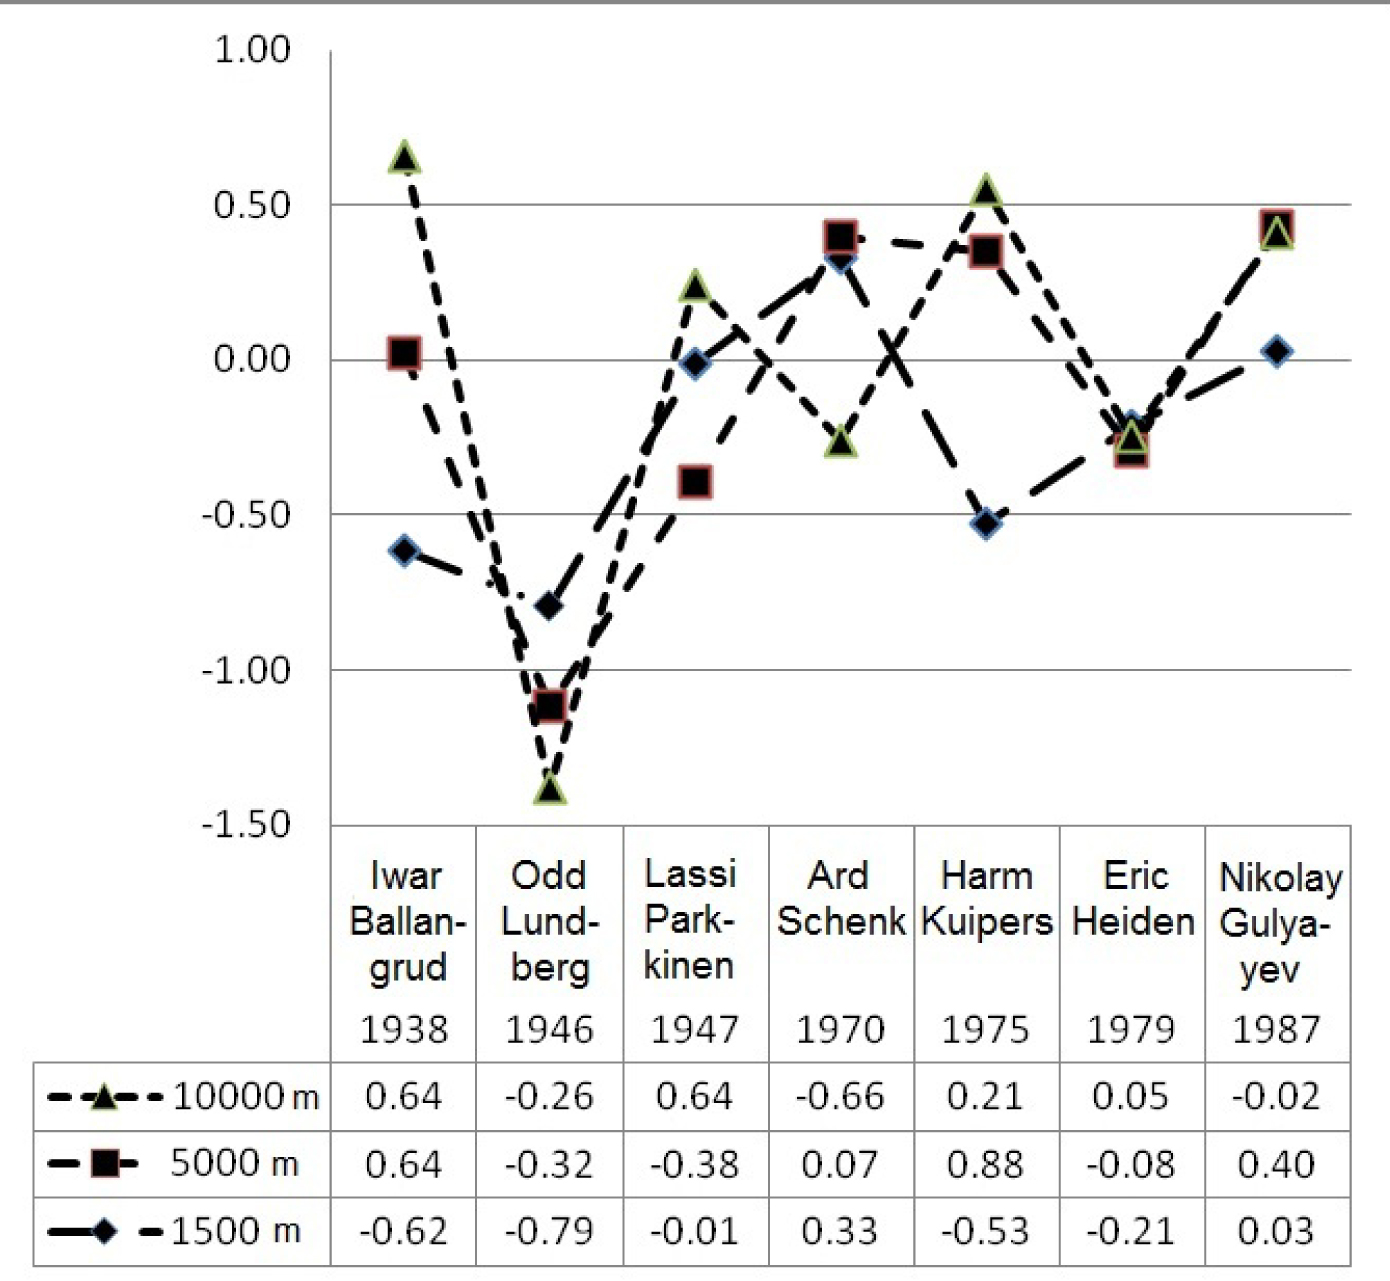
Diagram 1. Estimated results at all-round distances and their percentagewise difference from those demonstrated during competitions.
As the diagram shows, the difference between the actual and estimated results make up less than 1%: the widest scatter in results at 10000m distance is observed in Harm Kuipers and amounts to 0.88 %; at 5000m distance - in Ivar Ballangrud, and amounts to 0.64 % or 3.2 seconds.
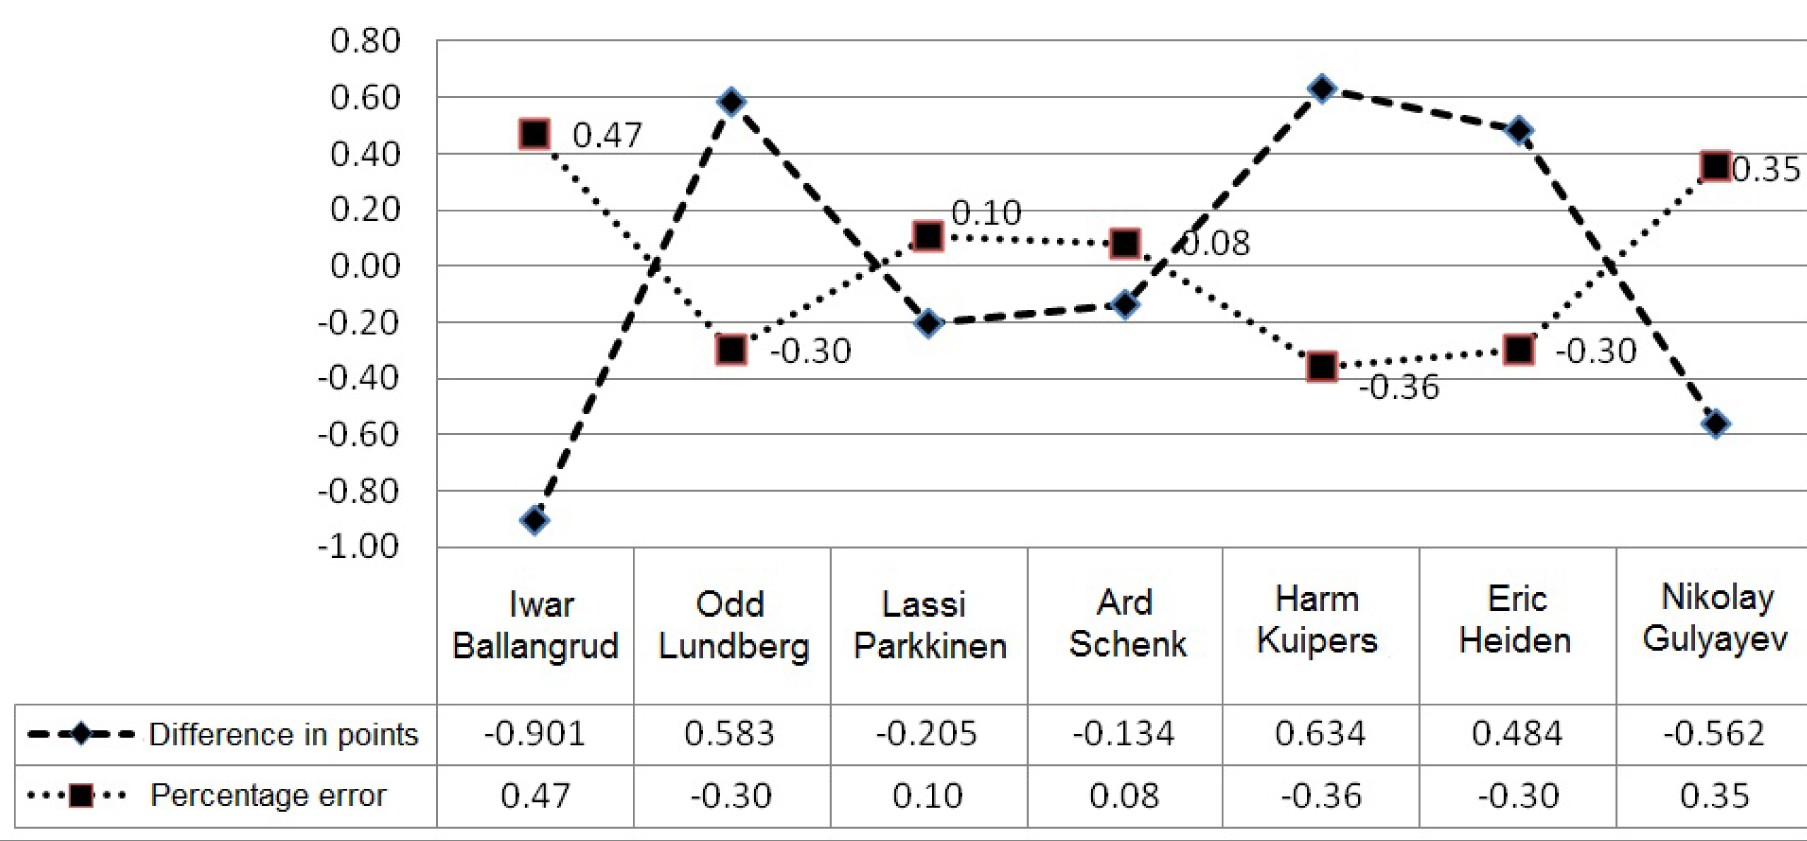
Diagram 2. Actual and estimated total of points in classic all-round speed skating.
Diagram 2 shows the difference in the estimated total of points and its percentage error, or the relationship of the actual and estimated indices. The rawest error is registered in Ivar Ballangrud and equals 0.47% or 0.901 points, the most insignificant one - in Ard Schenk and it is equal to 0.08% or -0.134 points. There was detected a relathionship between the sports results in the given group of speed skaters. The proposed linear regression equations enables us to forecast a sports result with high probability. Forecasting at 1500m and 5000m distances and the total of points in the all-round is made based on the time of 500m distance, and based on the time of 5000m distance - forecasting of the result at 10000m distance. The authors introduce the regression equation which reflects the linear dependence between the total of points in the all-round and the result at 500m distance in a multiple World, European and Olympic champion, a Dutch speed skater Sven Kramer [4].
Y= 3.19836хТ500 +31.6835
Where, Y- base index, a and b – regression coefficient.
Т 500 - sports result at 500m distance.
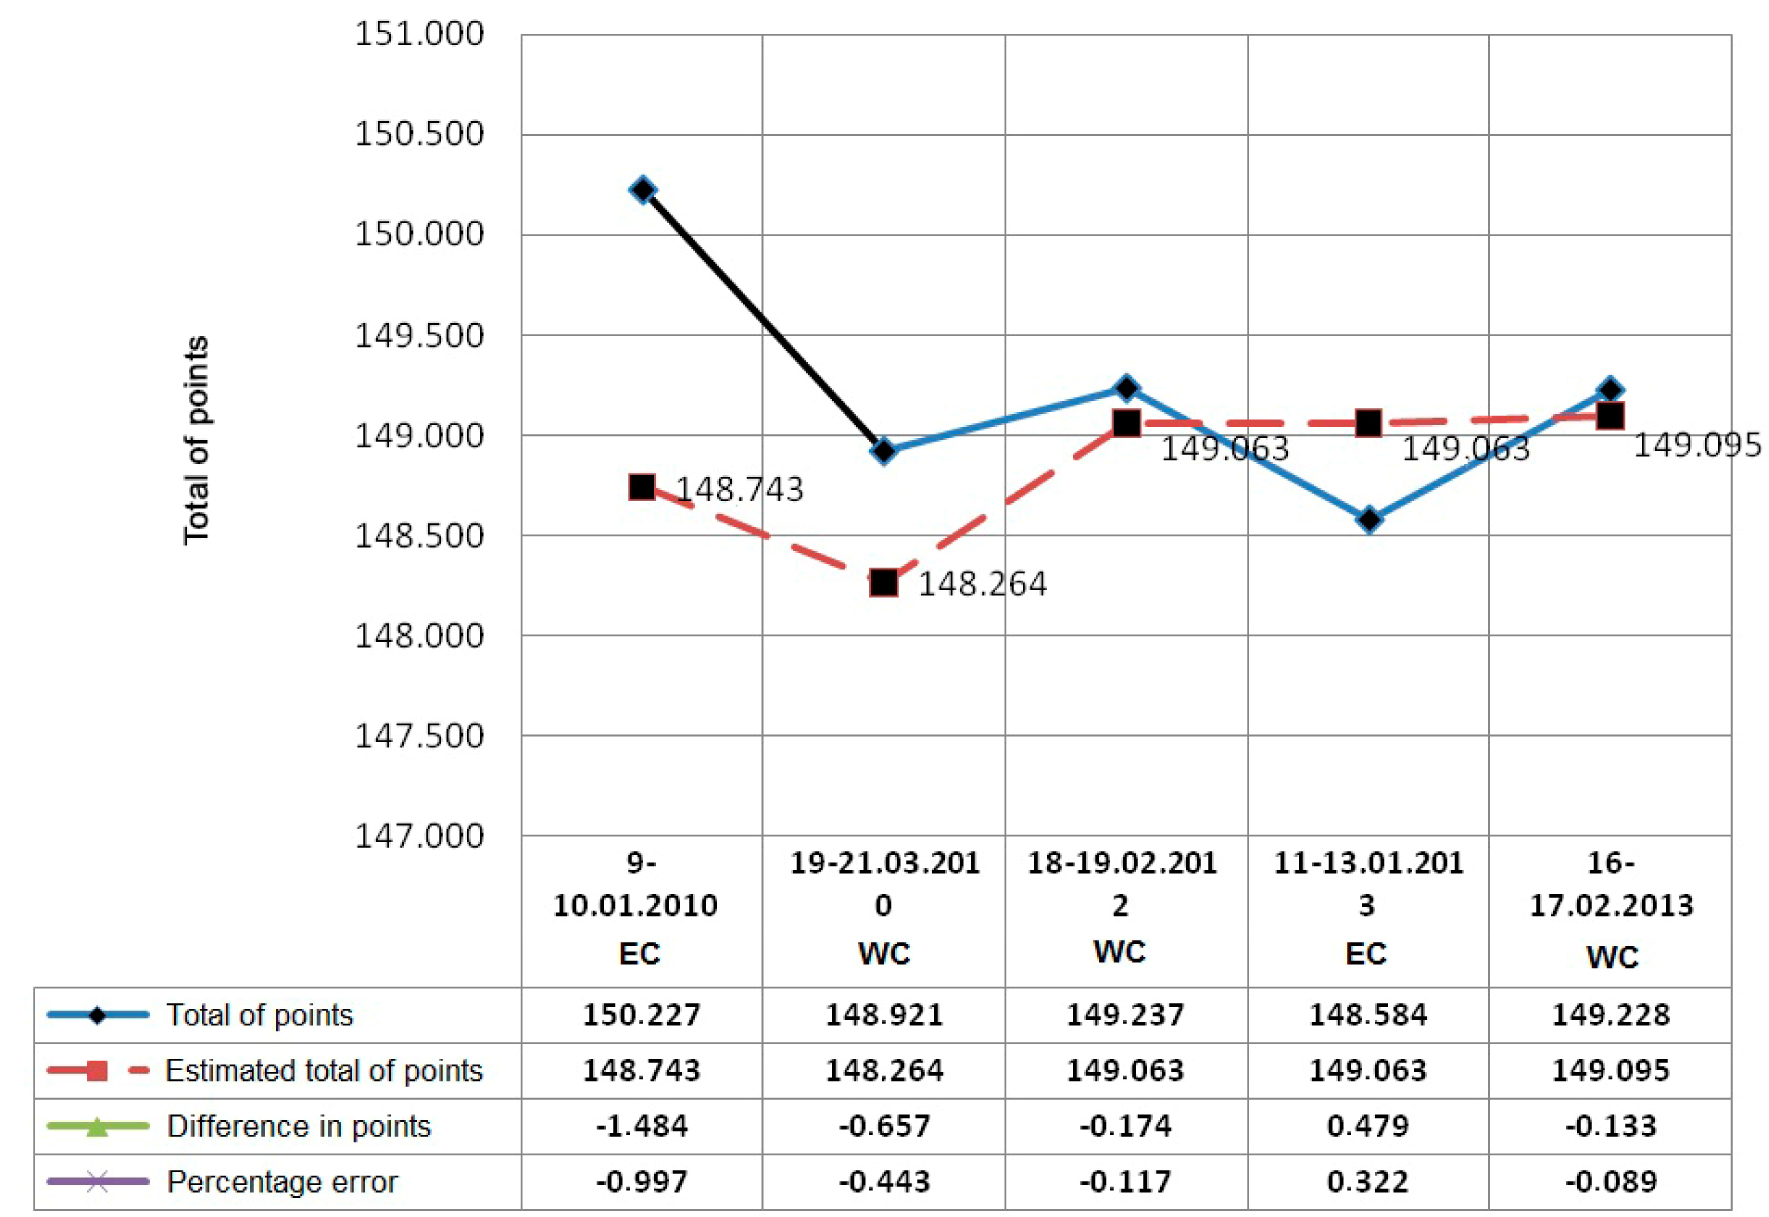
Diagram 3. Sven Kramer's total of points in all-round speed skating during European Championship (EC) and World Championship (WC) compared with estimated indices.
The estimated total of points in the all-round, the indices of the difference in points and the calculation error from the actual result demonstrated during competitions are marked in the diagram. It is to be noted that Sven Kramer performed in the 2010 European Championship after a long-term break due to treatment. His actual result compared with the predicted one amounted to less than 1%. In subsequent competitions - one European Championship and three World Championships, the estimated total error in the all-round amounted to 0.243±0.146%. In most biomedical researches, the degree of probability of accurate forecast equal to 95% is considered to be sufficient, and the incidence of the general totality, in which we can observe abmodalities, will not exceed 5%. The degree of probability used in a number of studies regarding, for example, high-toxic substances, vaccines is Р=99.7%, i.e. not than 1% of cases.
Conclusions.
- Using the methods of multivariate statistics, coaches can determine the relationship of athletic performance not only between all-round speed skating distances, but also at adjoined distances.
- Based on the identified relationships training means and methods for speed skaters can be modeled and results at the distances and the total of points in the all-round can be forecasted.
References
- Vasil'kovsky, B.M. Controlling special endurance level and standardization of training loads in training of highly skilled all-round speed skaters: Ph.D. thesis / B.M. Vasil'kovsky. – Мoscow, 1983. – 180 P. (In Russian)
- Volkov, N.I. Training of the strongest skaters of the world / N.I. Volkov, B.A. Stenin. – Мoscow: Fizkultura i sport, 1970. – 120 P. (In Russian)
- Mirkin, B.G. Analysis of qualitative characteristics and structures / B.G. Mirkin. – Мoscow: Statistika, 1980. – 319 P. (In Russian)
- Polozkov, A.G. Forecast of total points of Sven Kramer in all-round speed skating based on his 500 m result / A.G. Polozkov, G.A. Polozkov // Pedagogicheskie nauki. – № 6 (39). – 2009. – P. 89–90. (In Russian)
Corresponding author: tatyana.kovalenko@volsu.ru


 Журнал "THEORY AND PRACTICE