School Attendance and Its Connections with Other Components of Attitudes towards Physical Culture and Chosen Biological and Social Elements in Progress of Outdoor and Indoor Lessons of Physical Education
Фотографии:

ˑ:
Marcin Pasek, Monika Michaіowska-Sawczyn, Alicja Nowak-Zaleska, Artur Ziуіkowski, Wojciech Sakіak
Gdansk University of Physical Education and Sport
Key words: attendance, physical fitness, fatigue feeling, fatty-cutaneous fold.
Introduction
In recent years the pupils’ attendance of physical education lessons presents a decreasing tendency. One of the reasons for such a phenomenon is parental permissiveness. Such performance is difficult to be proved and frequency of its occurrence as a rule discourages teachers from engaging in explaining procedure. The non-education influence of such absence makes teenagers less adaptive for different rules of participation in future academic classes and moreover in their professional life. Physical Education is the lesson in which regular participation is an overriding value. Motor activity is the activity especially promoted in the groups oriented on strenuous mental work. The effect of skillfully controlled physical effort on health is more and more broadly noticed by educational hierarchy what results in a higher number of Physical Education lessons in schools.
While the presented problem to significant degree determines the quality of Physical Education lessons, in the specialized literature little attention is given to the issues of the attitude towards physical culture and the grounded suggestions on how to improve these disadvantageous tendencies are lacking.
The purpose of the study was to compare school attendance of pupils engaged in outdoor and indoor lessons of Physical Education, and evaluation of attendance connections with other elements of attitude towards physical culture and chosen biological and social factors.
Material and methods. 220 pupils from 4 schools of Pomeranian Voivodeship in the north of Poland (2 urban and 2 rural) were involved in the study. 2 groups from each school participated in the project: 2 groups of boys (experimental and control) and 2 groups of girls (experimental and control). The 5th and 6th-formers were examined. The main research method was natural experiment as a confirmed method of pedagogical analysis (Pilch, 1995). It is based on the investigation of a phenomenon in normal conditions, when the researcher only manipulates with introducing conditions modification. The experimental factor was an increase of the number of extracurricular outdoor lessons. Initially based on earlier research [1], the number of outdoor Physical Education lessons was on the level of 75% and 25-33% for the control and experimental groups, respectively. In the present research the achieved mean level was 60-65% and 30% for the control and experimental groups, respectively.
The research method used were as follows:
1. Registers of Physical Education teachers, on the basis of which lesson attendance was evaluated. These records helped calculate absence due to health issues, omitting other reasons.
2. 5-point mood scale that reflects an emotional attitude to a lesson before its beginning [1]. In the Scale 1 point signifies bad mood and dislike to participate in a lesson, whereas 5 points mean very good mood and willingness to participate in a lesson. For the needs of research in all cases the scale was applied before the lessons according to an identical program, namely before the 12-minute Cooper's test.
3. Test of knowledge made of 15 questions from the area of physical culture for prom pupils of Silesian secondary schools. The questions covered general problems connected with physical activity and its ecological conditions.
4. A questionnaire of attitudes by Baumgartner and Jackson provided to measure pupils’ attitude towards a specific lesson of Physical Education [3]. The task of each pupil participating actively in the lesson was to mark on the scale connecting each pair of adjectives, by circling the number mostly corresponding with his/hers opinion about the finished lesson. Pupils marked only those valuation aspects that were most understandable for them, divided opposite adjectives into 'bad' and 'good'. The mean score from all questionnaires filled by a pupil eventually represented the measurement of attitude.
5. Strzyїewski’s Survey [3] used to evaluate the attitude towards physical culture. It consisted of 67 questions referring to 3 components of attitude, namely cognitive, emotional and behavioral. The applied 5-point scale is used to specify the value and strength of attitude: 0-0,49 points – strongly negative attitude, 0,5-1,49 points – negative attitude, 1,5-2,49 points – neutral attitude, 2,5-3,49 points – positive attitude, 3,5-4 points - strongly positive attitude. Standards were used to evaluate all three components of the attitude and its global index.
6. International Test of Physical Fitness used to test general physical fitness and its individual components conducted with the usage of stop-watch, measurement belts, dynamometers, flags, horizontal bars, blocks and gymnastics benches with a centimeter scale. The set of tests consists of 8 elements: 50 m distance run – test of running speed, standing long jump – test of legs' strength, endurance run – test of endurance, measurement of palm strength using dynamometry and hanging on a horizontal bar – test of arms' and shoulders’ strength, 4Ч10 m run – agility test, falling leaf for 30 seconds – test for measuring abdominal muscle strength, angle body – flexibility test [4].
7. Step-test used to evaluate physical working capacity [5]. During 4 minutes pupils were ascending the 30 cm step with the rhythm of 30 reps a minute. During ascending they focused on full extension in the knee and hip joints and proper placing of both feet on the step. Pulse was measured a minute after the test completion. On the basis of achieved results of measurements we calculated the value of physical working capacity index by the formula: Ww = tЧ100/5,5Чp, where t - time of activity measured in seconds, and p – post-exercise heart rate. Metronome was used to determine the rate of step ascending and the sport-tester Polar (the model FS2c) - to measure heart rate.
8. The 10-point scale of Noble-Borg applied by pupils immediately after finishing the Cooper's test, where the value of 0,5 points corresponds with a very slight effort and the value of 10 points corresponds with an extremely hard effort [6].
9. The measurement of adipose tissue thickness using the British method [7] by the total of fatty-cutaneous folds on gastrocnemius and arm triceps. Fat Tester Accu-Measure Fitness 3000 was used in the measurements.
During the statistical analysis the lack of normal distribution was observed in most cases. It was a fundamental element arguing for the usage of the nonparametric test of differences significance. The comparison of attendance for pupils from the experimental and control groups was based on the data graphic presentation in the form of bar graph. The authors also evaluated the correlation between attendance and other factors of the attitude to physical culture using the Spearman rank correlation coefficient. The level of statistical significance used for calculations did not exceed 5% statistical error (p<0,05) and was marked with bold print in statistically significant cases. Whereas to compare such features as gender, place of residence, level of education and extracurricular physical activity of pupils involved and not involved in the experiment, the groups in which attendance was above and below the median value were compared.
Results. The attendance of Physical Education lessons in the group of pupils involved in the 2-year experiment was 3,5 % points higher than among the pupils from the control group what was a statistically significant difference (p<0,05).
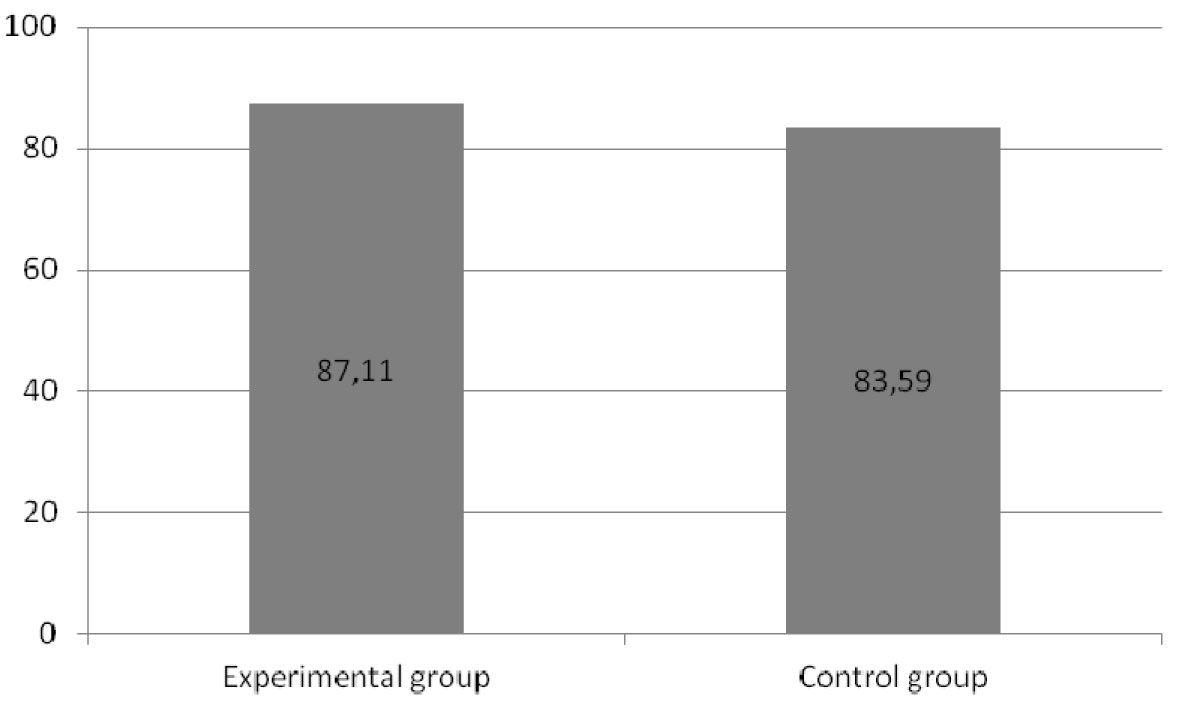
Figure. Average percentage level of attendance on Physical Education lessons in the experimental and control groups.
In the final tests we also analysed strength and direction of correaltions between attenadance and other factors of the attitude to physical culture. For both groups the same correlation was observed. Attandance remained in statistically positive correaltions with all tested components of attitude with exception of knowledge, in case of which the insignificant negative correlations was found.
Table 1. Correlation coefficient between Physical Education lessons attendance and other components of the attitude to physical culture for the experimental and control groups
|
Component of attitude to PE |
Experimental group |
Control group |
|
Attitude towards physical culture (aggregated index) |
0,4709 |
0,4012 |
|
Attitude towards physical culture (cognitive index) |
0,4129 |
0,2937 |
|
Attitude towards physical culture (emotional index) |
0,5085 |
0,3804 |
|
Attitude towards physical culture (behavioral index) |
0,5229 |
0,3963 |
|
Mood |
0,4584 |
0,2967 |
|
Knowledge |
-0,0560 |
-0,0870 |
|
Lesson evaluation |
0,4576 |
0,3102 |
|
General attitude |
0,5003 |
0,2979 |
Table 2. Correlation coefficient between Physical Education lessons attendance and specific somatic and functional features
|
Feature Group |
Fatty-cutaneous folds |
Physical fitness |
Physical working capacity |
Fatigue |
|
Experimental group |
-0,2748 |
0,5886 |
0,4124 |
-0,2187 |
|
Control group |
-0,1350 |
0,4108 |
0,1759 |
-0,2745 |
The gender-related differences in the level of attendance in the experimental and control groups were minimal. Both, boys and girls represented attendance above and below the median value in a very comparable number of cases.
Table 3. Comparison of attendance index for boys and girls
|
Gender
Group |
Boys |
Girls |
||
|
Higher attendance |
Lower attendance |
Higher attendance |
Lower attendance |
|
|
Experimental group |
18 pupils |
24 pupils |
23 pupils |
26 pupils |
|
Control group |
28 pupils |
29 pupils |
25 pupils |
27 pupils |
Similar observations were marked when analyzing attendance considering the place of residence of subjects of the experimental and control groups. The differences in Physical Education lessons attendance between teenagers from urban and rural areas were not observed.
Table 4. Comparison of attendance index between pupils from urban and rural areas
|
Place of living
Group |
Town |
Village |
||
|
Higher attendance |
Lower attendance |
Higher attendance |
Lower attendance |
|
|
Experimental group |
21 pupils |
24 pupils |
20 pupils |
26 pupils |
|
Control group |
22 pupils |
26 pupils |
31 pupils |
30 pupils |
In the experimental group higher or lower attendance than the median value was marked in a comparable number of pupils having parents with university education. Whereas in the control group the attendance of the pupils, whose parents had university education, was twice higher than that of pupils engaged in these lessons less frequently. However, the attendance of children in both tested groups, whose parents’ education level was different than university, was below the median value.
Table 5. Comparison of attendance index among pupils with parents having different levels of education
|
Education
Group |
University education |
Education other than university |
||
|
Higher attendance |
Lower attendance |
Higher attendance |
Lower attendance |
|
|
Experimental group |
16 pupils |
19 pupils |
25 pupils |
31 pupils |
|
Control group |
18 pupils |
9 pupils |
35 pupils |
47 pupils |
Attendance of the pupils from the experimental group physically active after school was not higher than the median value but such a situation was observed among the pupils from the control group. However, attendance of physically low active pupils in both groups was more often below the median value.
Table 6. Comparison of attendance between pupils physically active and inactive after school
|
Physical activity
Group |
Active |
Inactive |
||
|
Higher attendance |
Lower attendance |
Higher attendance |
Lower attendance |
|
|
Experimental group |
17 pupils |
19 pupils |
24 pupils |
31 pupils |
|
Control group |
21 pupils |
9 pupils |
32 pupils |
47 pupils |
Very low attendance of school lessons of Physical Education is more common for school of a higher level than junior high and mainly among girls, and the reasons for this include: lack of formed habits among young people during their earlier stages of education, level of pupils’ physical fitness and complexes related with it, low attractiveness of Physical Education lessons, excessive demands of teachers and low social awareness of the role of physical activity in the human life, as well as parents’ desire to develop children intellectually rather than physically [9].
A broad case study of the phenomenon was presented by Supreme Audit Office that published results of tests conducted in the area of Physical Education in public schools [10]. The low level of pupils’ active engagement in Physical Education lessons (i.e. pupils who were present and exercising) was observed in all controlled schools with a tendency to decrease from 77,5% in the school year 2007/2008 to 76,7% in the school year 2008/2009. The number of pupils actively engaged in the lessons decreased during the next stages of education and in researched school years: on the second stage (4th – 6th grades of primary school) – 16.8% (0.2% decrease in the analyzed period), on the third stage (junior high) - 21,1% (0,6% decrease), and on the fourth stage (post junior high schools) – 30,7% (1,6% decrease). Above mentioned observations confirm the tests conducted during Supreme Audits Office’s monitoring concerning pupils’ participation in Physical Education lessons during selected week of the school year 2009/2010. On the second stage of education 18,9% of pupils did not participate in lessons actively, on the third stage it was 24,2%, respectively, and on the fourth 36,1%. A visible increase of the critical attitude of pupils to participation in Physical Education lessons was observed in the examined schools and the process deepens from stage to stage. The opinion that these lessons are not interesting was expressed by nearly one fifth of pupils from last grades of primary school, one fourth of pupils from junior high and one third of pupils from post junior high school from the surveyed group.
A few years earlier, an interesting concept of increasing lesson attendance was suggested, namely an original method of pupils’ evaluation on the basis of the criterion of percentage non-attendance of the lesson, according to the following scale: 05 – 10% - very good mark, 11% - 20% - good, 21% - 30% - satisfactory, 31% - 40% - acceptable, above 50% - pupil is not classified [11]. However, most of the attempts to increase the interest in school lessons of Physical Education deserved recognition, though when determining similar to presented percentage rigors doubts are possible concerning the motives which would be the most important for pupils participating in the lesson. Additionally, the author marks that it can become less efficient to improve physical fitness by means of activity. While, lessons attendance decreases, the use of a wider range of outdoor exercises facilitates their attractiveness and thus helps pupils be active corresponding to their capabilities and interests, simultaneously taking into consideration their sports achievements, fitness level and state of health. Pupils believe it may help increase the general recognition of school as an institution where their development is facilitated and as a consequence unfavorable tendencies related with participation in school lessons of Physical Education can be eliminated.
CONCLUSIONS
In the verification of the research hypotheses it can be stated that the experimental factor in the form of higher number of outdoor Physical Education lessons became the reason for higher lesson attendance, significantly better than in the simultaneous study of the control group.
Attendance of more outdoor Physical Education lessons does not influence the correlations between attendance and other factors of the attitude to physical culture. The authors did not find any distinct difference in strength and direction of the correlations between Physical Education lessons attendance and selected somatic and functional features of pupils from the experimental and control groups.
Among social factors potentially influencing the level of attendance of outdoor and indoor lessons of Physical Education, only the role of extracurricular physical activity can be distinguished. The differentiation of pupils according to other factors, such as parents’ level of education, gender and place of residence did not significantly influence the level of attendance, which was observed in both research groups.
References
- Paсczyk W. Biologiczno-zdrowotne i wychowawcze efekty lekcji wychowania fizycznego w terenie i w sali. ODN, Zamoњж 1999.
- Gуrna K. Przygotowanie mіodzieїy do uczestnictwa w kulturze fizycznej. AWF, Katowice 2001.
- Brudnik M. Kwestionariusz postaw Baumgartnera i Jacksona do badania postaw uczniуw wobec lekcji wychowania fizycznego. Przykіad Skali rуїnicowania znaczeniowego. Wychowanie Fizyczne i Sport 1994, 3, 57 – 67.
- Pilicz S., Przewкda R., Dobosz J., Nowacka-Dobosz S. Punktacja sprawnoњci fizycznej mіodzieїy polskiej wedіug Miкdzynarodowego Testu Sprawnoњci Fizycznej. Kryteria pomiaru wydolnoњci organizmu testem Coopera. AWF, Warszawa 2005.
- Osiсski W. Wielokierunkowe zwi№zki zdolnoњci motorycznych i parametrуw morfologicznych. Monografie AWF, Poznaс 1988, 261.
- Noble B., Borg G., Jacobs J., Ceci R., Kaiser P. A category ratio perceived exertion scale: relationship to blood and muscle lactates and heart-rate. Med. Sci. Sports Ex. 1983, 15 (2), 520 – 524.
- Lohman, T. G. The use of skinfolds to estimate body fatness on children and youth. Journal of Physical Education, Recreation & Dance 1987, 58 (9), 98 – 102.
- Zaustowska B. Zwolnienia z lekcji wf w opinii uczniуw i lekarzy. Lider 2007, 11, 25 – 27.
- Gutkowska-Wyrzykowska E. Zwolnienia lekarskie – jeden z dylematуw szkolnej kultury fizycznej. Wychowanie Fizyczne i Zdrowotne 2009, 10, 37 – 38.
- Najwyїsza Izba Kontroli, Departament Nauki, Oњwiaty i Dziedzictwa Narodowego. (kno-410-01-00/2009 nr ewid. 40/2010/p/09/069/kno). Informacja o wynikach kontroli. Wychowanie fizyczne i sport w szkoіach publicznych. Warszawa 2010.
- Buczek Z. Inny sposуb oceniania z wychowania fizycznego. Lider 2001, 4, 25.
Corresponding author: pasek@hot.pl


 Журнал "THEORY AND PRACTICE