Attitude to Physical Culture and Level of Physical Activity in Leisure Time in Youth of Krakow
Фотографии:

ˑ:
Jurczak A. 1, Ambroїy T. 2, Mucha D.3, Dybiсska E. 2, Kucia-Czyszczoс K.2
1 Department of Social Sciences, Academy of Physical Education, Cracow
2 Department of Sports, Academy of Physical Education, Cracow
3 Department of Human Physiology, Academy of Physical Education, Cracow
Key words: attitude, physical activity, youth
INTRODUCTION Physical activity is the basic means of all areas of physical culture. Its presence in the lifestyle is the guarantee of sustainable biological, mental and social development in the meaning of mutual connections and interactions (Raglin et al. 2007, Bailey 2009). Exercising its various forms in the atmosphere of caring about pedagogical and hedonistic aspects is conducive to development of appropriate attitudes. One of the methods of increasing the level of physical activity in the youth is education, or conscious and planned social activity aimed at the disciple assimilating permanent and desirable attitudes (Osiсski 2011).
In the theoretical view, the structure of attitude includes learning, emotional and motoric components with fixed behaviours or predispositions to behaviours to, e.g., the body in the prosomatic attitude (Grabowski 1999). Attitudes to physical activity, and to one’s own body and its needs as a result, may be regulated with the values: recognised (conscious, expressed in statements), felt (regarded as an object of aspirations and striving) or executed (expressed in actual behaviour) (Krawczyk 1983).
The research on optimisation of the process of physical education in Poland shows that “the attitudes of the youth are not sufficiently internalised, and teaching the skills and knowledge does not develop the grounds for autonomous undertaking of physical activity. The following aspects proved to be the most decisive according to the youth: emotional aspect, learning aspect and self-assessment of the motor competency” (Bronikowski 2008, p. 28). Developing prosomatic attitudes is apparently an objective which is insufficient for autonomous maintenance and enhancement of health. Planned educational and pedagogical activities in the climate of positive emotions is necessary.
OBJECTIVE OF RESEARCH. The objective of the research was an attempt at assessment of the effect of attitudes to physical culture and its individual components on development of physical activity in leisure time in a selected group of the youth of Krakow. Three research questions were formulated in order to make the objective of the research more precise: 1. What is the level and structure of attitudes of the analysed youth to physical culture? 2. Does the attitude to physical culture and its components depend on gender and the level of physical activity in case of the analysed youth? 3. Which components and areas of physical culture were changed as a result of varied levels of physical activity?
MATERIAL, METHOD. The research covered the youth of Krakow from 5 (out of 40) random secondary schools, with the total number of 1172 participants (715 girls, 457 boys). Diagnostic survey was used as the research method. The youth was examined with the use of 2 standardised questionnaire forms.
The first one measured physical activity in leisure time (Winiarski 1995), in which the global coefficient of physical activity level resulted from summing up of all frequencies within a week. 4 categories constituted the variable: “none” in the youth who did not take any physical activity, “low” for those with less than 1 activity per week, “moderate” with 1-3 activities in a week, and “high” for those with 4 or more activities in a week.
The second questionnaire measured attitudes to physical culture (Gуrna 2001. in: Strzyїewski 1989), where the youth responded to 67 questions assessing the attitude in terms of the components: learning (26 questions), behavioural (21 questions), and emotional (20 questions). This questionnaire additionally offered the possibility of analyses of 10 areas related to physical culture: The youth responded to questions expressing their strength of conviction to whatever constituted the contents of physical education in a 5-degree scale. The conclusions assumed the 2 points coefficient as corresponding with the neutral attitude. The shift towards 2 to 2.5 means intensification of the moderately positive index, with 2.5-3.0 regarded as positive, and definitely positive when the value exceeded 3.0. Conversely, when the value was 2.0-1.5, the index was regarded as moderately negative, and negative for 1.5-1.0. The values lower than 10-0.0 were definitely negative.
The analysed values showed diagonal distribution, which is why non-parametric tests were used in which median was the measure of the central trend. The measuring tests were those of Mann and Whitney, Kruskall-Wallis, Friedman’s median test and “post-hoc.”
RESULTS. The median of the global coefficient of the attitude of the youth to physical culture is 2.28 and thus it is within the range of moderately positive attitudes. Unfortunately, it is rather hardly possible for the attitude close to the values of undeveloped attitudes (2.0) to be a driving force to elicit active participation in physical culture (Chart 1).
Legend:
a) WP: attitude to physical culture, D: girls, C: boys, N: number of subjects, R: average rank, Me: median, H: Mann and Whitney test value,
b) 1/1 (chart area): dependence on gender (*** p>0.001).
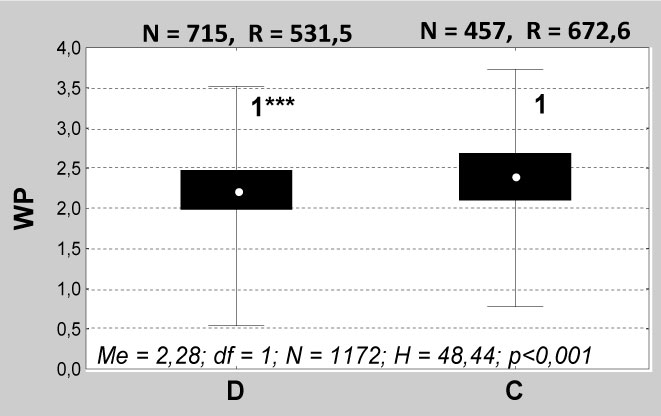
Chart 1. Gender and attitudes of the youth to physical culture
The median of girls’ attitudes to physical culture was significantly lower (2.23) in comparison to the boys’ (2.41). The existing differences in the medians (p<0.001) could not justify, however, the attitudes in boys to be regarded as positive, because the location of the median indicates rather moderately positive attitudes (Chart 1). Boys represented a higher (positive) level of the attitude only in 75%. Unfortunately, none of the girls reached this scale in this degree. In turn, positive and definitely positive attitudes refer only to 25% of girls and boys. Even though, it is clear that the attitudes in boys are more developed, coherent and stronger than those in girls.
The attitudes of the youth to physical culture positively affects the level of physical activity in leisure time: p<0.001. Moreover, the multiple correlation proves that the differences between all the levels of physical activity were statistically significant (p<0.05 – 0.001) and the values of medians above the average appeared in the “average” and “high” PAF ranges. Thus, it is clear that the medians of the attitude coefficient in higher PAFs had significantly higher values from the medians in lower PAFs.
LEGEND:
a) WP: attitude to physical culture, D: girls, C: boys,
b) PAF: level of physical activity: PAF: 0 (none), PAF: 1 (low), PAF: 2 (average), PAF: 3 (high),
c) 1/1. 2/2. 3/3, 4/4 etc. (chart area): dependence between variable values (*** p<0.001: post-hoc analysis),
d) “PAF: 0 girls / PAF: 0 boys,” “PAF: 1 girls / PAF: 1 boys,” etc. (the lower part of the chart): gender effect (*p<0.05; **p<0.01; ***p<0.001).
e) Me, N, df, H: statistical measures: Me: median, N: number of subjects, df: degrees of freedom, H: Kruskall-Wallis test value.
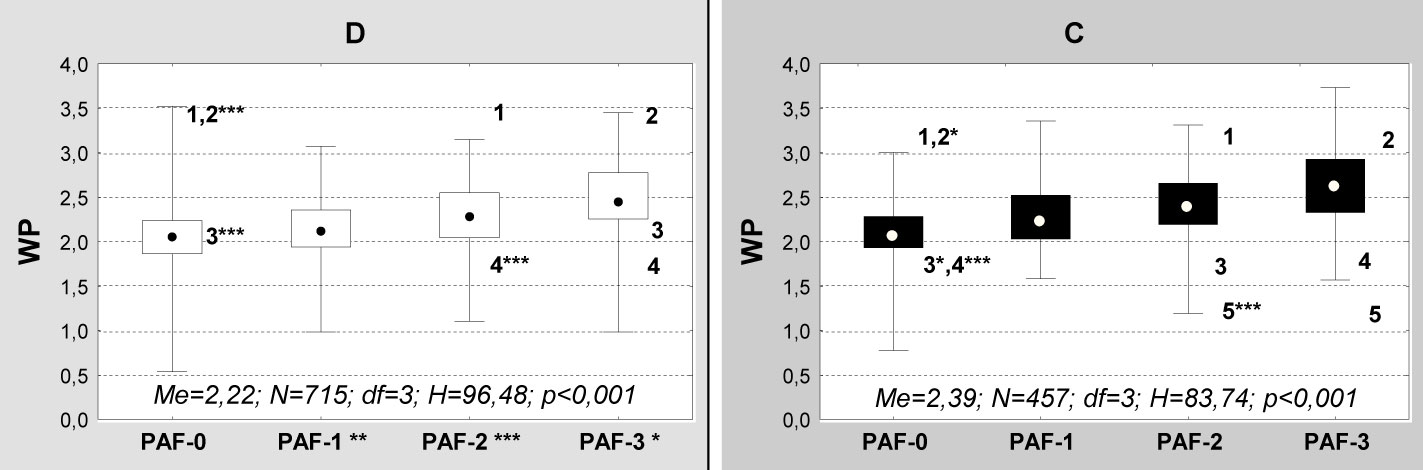
Chart 2. The effect of the attitudes of girls and boys to physical culture on the level of physical activity in leisure time
The attitude to physical culture of girls and boys affected the level of physical activity (PAF) in leisure time. In case of both groups, the existing dependencies were statistically significant (p<0.001) with multiple correlation indicating significant differences (p<0.05-0.001) between all PAF ranges except for the “none-low” category in the group of girls and boys. Another example of strong differentiation in the analysed variables was the dependence between gender in each PAF range except for the subjects who did not take any physical activity (the “none” category). In all cases where differences were recorded, the median of attitudes of girls was lower than in case of boys, respectively in the individual PAF categories: “low” (girls 2.13 – boys 2.24), “average” (2.31-2.41), “high” (2.48-2.61). The presented examples show that the average values of the attitudes were mostly moderately positive, with only one case of positive (2.61) – which proves poorly developed attitudes to physical culture. It is also clear that the attitudes in the subjects of both genders were more coherent in the “average” and “high” PAF categories than in the “low” category and in the subjects who did not take any physical activity (the “none” category) (Chart 2).
The increase in the value of the median of the learning component of the attitude means the increase in the PAF index: p<0.001. The additional multiple correlation showed that the differences between the medians of all the values of the component in all PAF ranges were statistically significant (p<0.01-0.001) and the average value of the median of the attitudes (2.48) in the individual PAF categories was moderately positive. The values of the median above the average were apparent in the “average” and “high” PAF categories.
LEGEND:
a) KP: index of learning component of the attitude to physical culture,
b) other: see Chart 2.
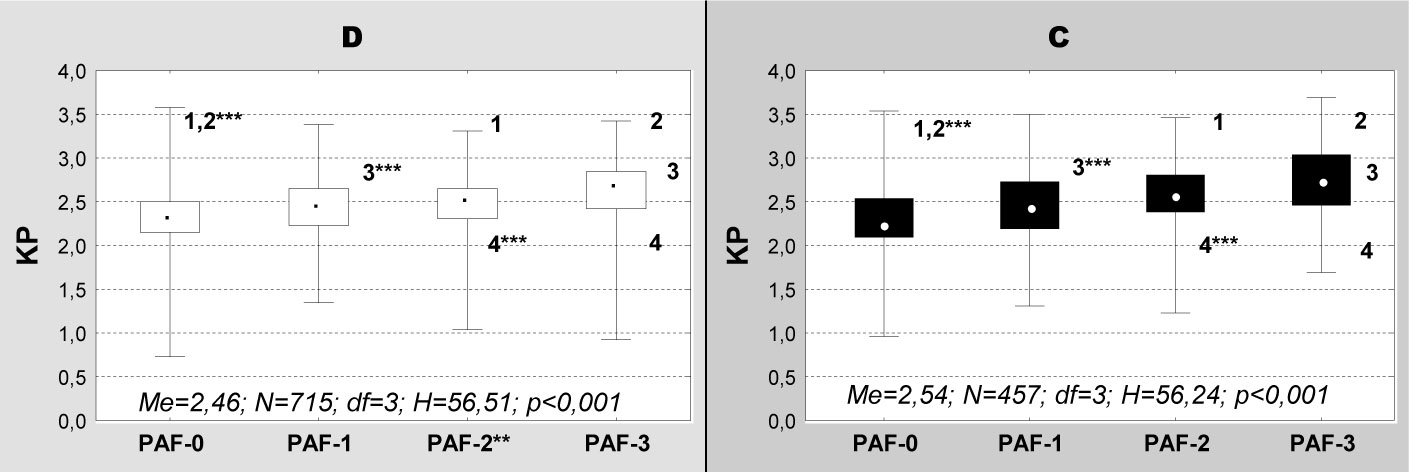
Chart 3. The effect of the learning component in the attitudes of girls and boys on the level of physical activity in leisure time
In the group of girls and boys, the increase in the median of the learning component resulted in the increase of the level of physical activity: p<0.001. The group of girls with the value of the median above the average (2.46) included only those girls whose PAF was high (2.65). In the other PAF categories, the median was lower, respectively: “none” 2.31. “low” 2.42. “average” 2.31. In turn, the group of boys with the value of the median above the average (2.54) included the subjects whose PAF was “average” (2.56) and “high” (2.73). In the other two PAF categories, the median was lower: “none” 2.25, “low” 2.42. The additional multiple correlation showed significant differences (p<0.001) between all PAF ranges except for the “none-low” and “average-high” categories in the group of girls and boys. In turn, the dependence on gender (p<0.01) was clear only in the “average” PAF category, where the median of the learning component in girls was 2.65, and in boys 2.75 (Chart 3).
The analysis showed that the learning component of the attitude was poorly developed (5 out of 8 value of the variable were moderately positive, and 3 were positive). The analysed variable depended on gender to a small degree, with significant differences being recorded only in the “average” PAF range. The moderately positive attitude to the knowledge related to physical culture was more coherent only in the group of boys.
The increase in the level of physical activity coexisted with the increase in the median of the emotional component of the attitude: p<0.001. The multiple correlation showed that the differences between the median of the attitude component were significant in the majority of the PAF ranges (p<0.001) except for the “none-low” category. The averaged value of the median of the emotional component was 2.46, with the average and high PAF range median above it, and the “none” and “low” category below.
LEGEND:
a) KE: index of emotional component of the attitude to physical culture,
b) other: see Chart 2.
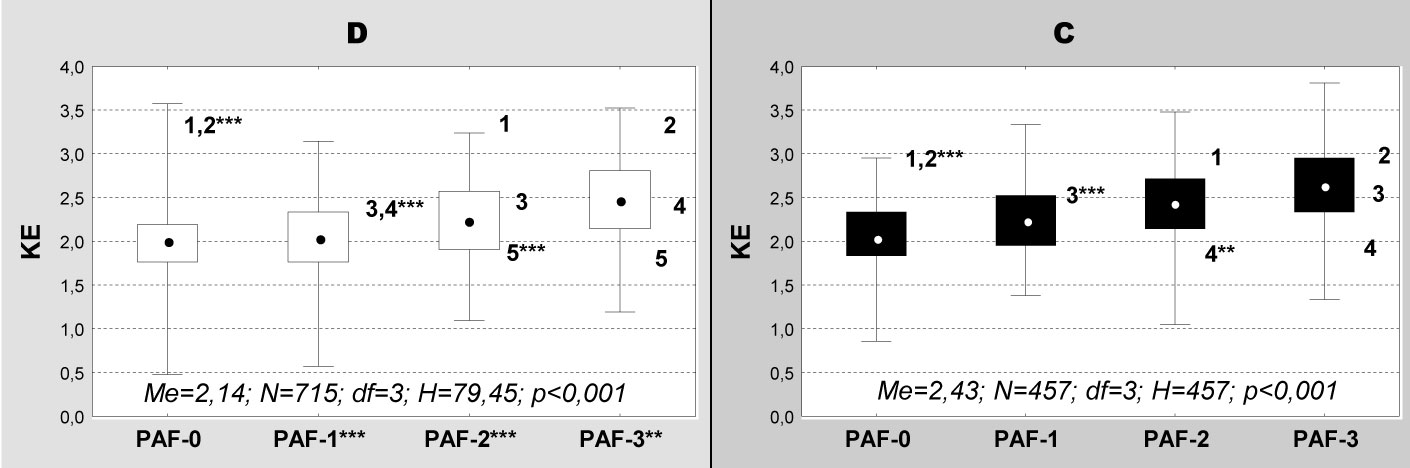
Chart 4. The effect of the emotional component in the attitudes of girls and boys on the level of physical activity in leisure time
The increase in the value of the emotional component of the attitude was correlated with the increase in PAF: p<0.001 both in girls and in boys. The combined median of this component in girls was 2.14. Above this value, the average of the attitude for the “high” (2.48) and “average” (2.24) PAF range was recorded, and below it, the “none” (2.0) and “low” (2.05). In turn, in case ofboys, the global median of the component was 2.43, with the medians of the “average” (2.44) and “high” (2.62) PAF categories above, and the “low” (2.34) and for those boys who did not undertake any physical activity (2.05) below. The results show that the component was mostly of moderately positive and positive nature, but only for the high level of physical activity. Additionally, multiple correlation showed significant differences (p<0.01-0.001) between all the PAF ranges except for the “none-low” category in the group of girls and the same in the group of boys. The dependencies between gender and the medians of the individual PAF ranges may be found in 3 out of 4 categories (p<0.01). In each case, the medians of the emotional component in girls were significantly lower than in boys: 2.05-2.34 in the “low” category, 2.24-2.43 in the “average” range and 2.48-2.62 in the “high” PAF range. It is interesting to note that the said differences between genders were negligible among the youth who did not take any physical activity (Chart 4).
All in al, one has to conclude that the emotional component of the attitude was close to the values proving poorly developed emotional attitude to physical culture. The value of this component was significantly different depending on the gender of the subjects, with significant differences recorded in 3 out of 4 PAF categories (low, average, high).
The behavioural component of the attitude depended on the level of physical activity (p<0.001) with increase in PAF resulting in the increase of the component index. Multiple correlation did not show any differences between “low-average” PAF medians, while in other categories these differences were significant (p<0.001). The average of the median component was 2.1, with the median of the “average” and “high” ranges above it, and “low” and “none” below it. The negative attitude of the emotional component was recorded in the youth of low level of physical activity (Me 1.83) and in the subjects who were not physically active (Me 1.97).
LEGEND:
a) KP: index of behavioural component of the attitude to physical culture,
b) other: see Chart 2.
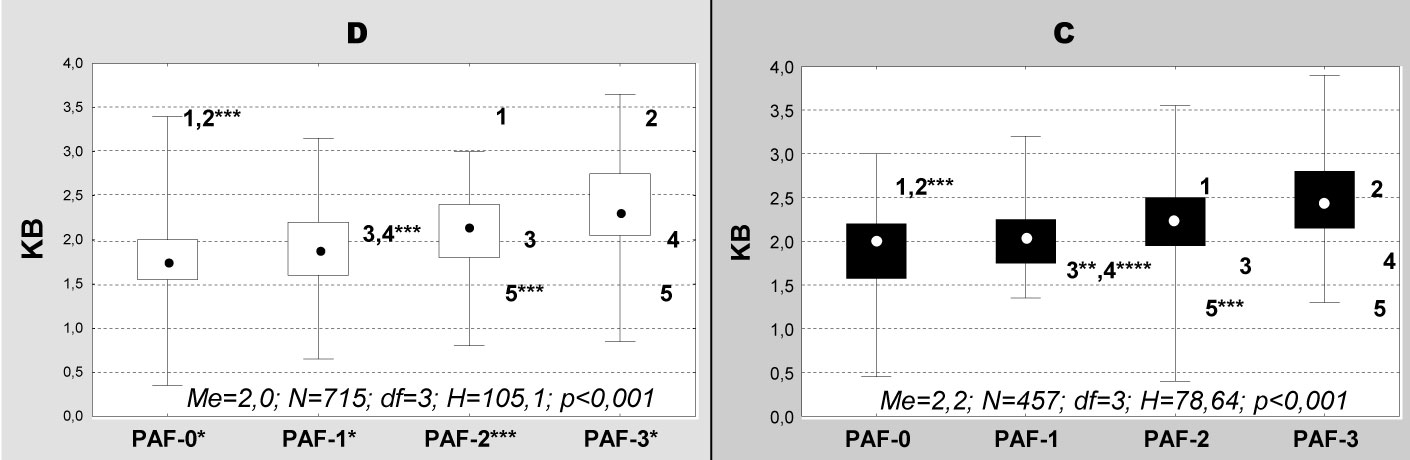
Chart 5. The effect of the behavioural component in the attitudes in girls and boys on the level of physical activity in leisure time
The behavioural component both in the group of girls (p<0.001) and boys (p<0.001) depended on PAF: the increase in the value of the component was positively correlated with the increase in the level of physical activity. Above the average of the component (the median 2.0) girls with “high” (the median 2.3) and the “average” (the median 2.15) PAF were found, with the categories of “none” (1.75) and “low” (2.0) below. In turn, in the group of boys above the average (the median 2.2) PAF was “average” (the median 2.25) and “high” (the median 2.45). Lack of physical activity (the median 2.05) and “low” PAF (2.34) are the values of the medians below the average. The presented examples show that only the behavioural component in girls who did not take any physical activity was moderately negative. Multiple correlation showed significant differentiation in the medians (p<0.05-0.001) between all the levels of physical activity, except for the “low-average” category in the group of girls and in the group of boys. Important dependency on gender (p<0.01) is apparent in 3 out of 4 PAF categories. In each case, the median of the component of attitudes of girls was significantly lower than in case of boys and reached 1.9 to 2.05 in the “low” level, 2.15 to 2.25 in the “average” level, and 2.3 to 2.45 in the “high” level. No significant differences between the median of the component and gender were found in the youth who did not undertake any physical activity (Chart 5). The behavioural component was thus the weakest link of the attitude. The medians in 2 out of 5 comparative groups showed values proving negative behaviours, neutral (undeveloped) in 3 and moderately positive in 3.
LEGEND:
a) WP: attitude to physical culture, PAF 0: no physical activity, PAF 3: high level of physical activity, F; Friedman’s test, N: number of subjects, df: degrees of freedom, p: level of significance, KP: learning component, KE: emotional component, KB: behavioural component,
b) ***: dependence at the level p<0.001 between the pairs of individual components of the attitude (“KP / KP,” “KE / KE,” “KB / KB”).
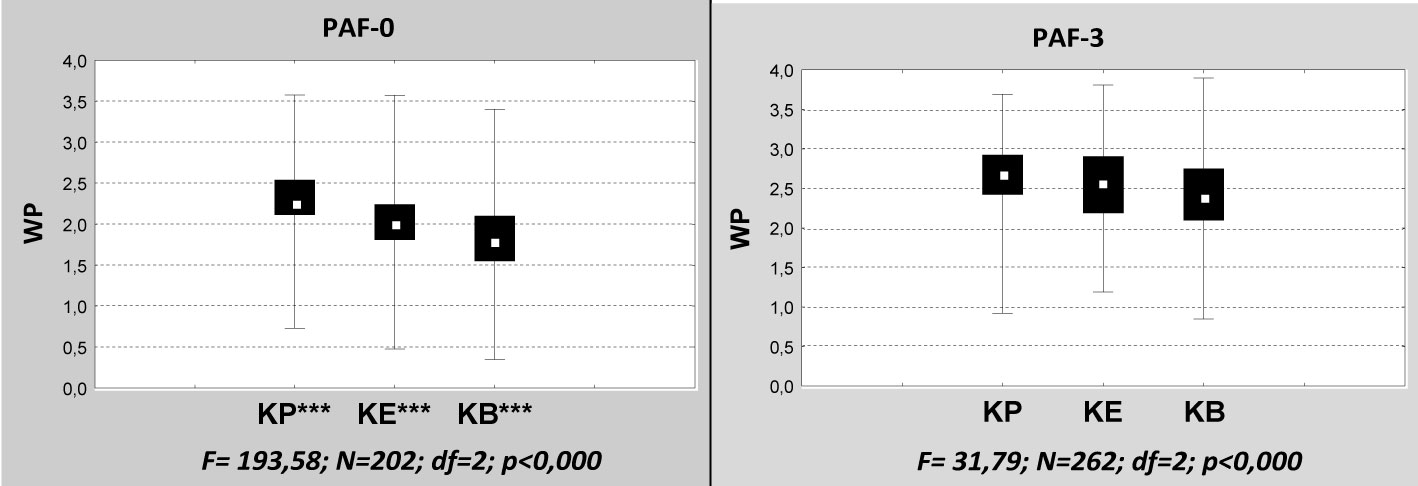
Chart 6. Differentiation in individual components of the attitude of the youth to physical culture depending on extreme values of the level of physical activity
The difference between component of the attitude among the youth who did not take any physical activity and between the components among the subjects who undertook activity at the high level was significant p<0.001. The medians of the attitudes to all the components of high level of physical activity were significantly higher than the components in the youth not active physically, with the median of the learning component increased from 2.29 to 2.67; the emotional component from 2.0 to 2.57 and the behavioural component from 1.83 to 2.4 (Chart 6).
LEGEND:
a) OKF: areas of physical culture: 1: social values of physical culture; 2: health values of motoric activity; 3: own physical fitness and physical development; 4: motoric activity in leisure time; 5: self-control and self-assessment; 6: PE lessons and fitness exercises; 7: sport and sports games; 8: partner and opponent in sports fights; 9: idea of olympic games competition and tradition in physical culture; 10: learning activity in physical culture,
b) WP: attitude to physical culture, PAF 0: no physical activity, PAF 3: high level of physical activity, Me, N, df, F, p: statistical measures: cf. Chart 6.
c) *: dependencies between pairs of particular physical culture areas: 1-1; 2-2; 3-3; etc. (p<0.001).
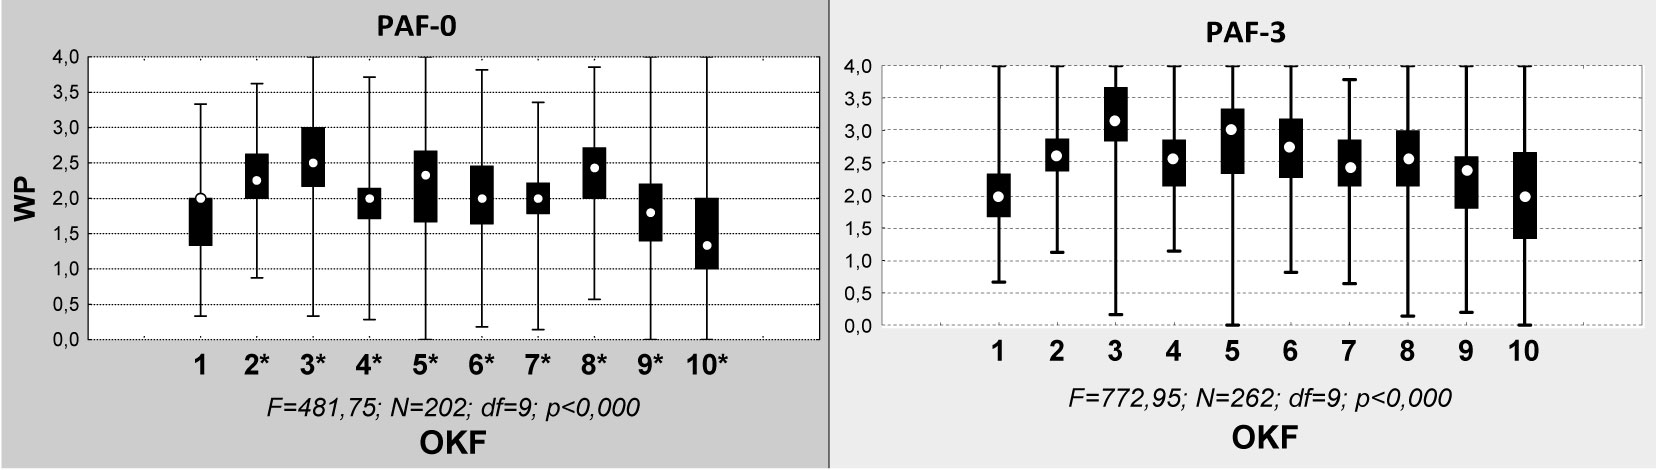
Chart 7. Differences between attitudes to physical culture areas depending on extreme values of the level of physical activity
The differences between attitudes to each of 10 areas of physical culture and the inactive youth and the youth active physically at the high level proved to be significant: p<0.001 (Chart 7). The medians of the attitudes to all the areas of physical culture except for the social values of physical culture among the youth of high level of physical activity were significantly higher than the medians in the subjects physically inactive. The highest increase was recorded in the area of own physical fitness, physical development, self-control, self-assessment and learning activities in physical culture. Slightly lower increase was recorded in health values of motoric activity, PE classes, fitness exercises, sport and sports games. The lowest increase was recorded in the areas of the partner and opponent in sports fights, in the ideas of olympic games competition and traditions in physical culture. The motifs which resulted in significant increase in the level of physical activity proved to be somatic values (fitness, development) and intellectual values and self-control and self-assessment.
Conclusions
- The median of the attitude to physical culture in the youth was within the moderately positive and positive area and was significantly higher in case of boys than girls.
- The attitude to physical culture and its components affected the level of physical activity of the youth in leisure time. Irrespective of the level of physical activity, the attitudes in girls in any range were lower than the attitudes in boys. Increase in the level of physical activity depended mostly on the learning component of the attitude, with slightly lower dependency on the emotional component and the lowest dependency on the behavioural component.
- Above the averaged values of the attitudes for individual categories of the level of physical activity was the youth whose level of physical activity was average and high.
- The median of the components of the attitude of the youth to physical culture was in the range of 2.0-2.73. Irrespective of the level of physical activity, the median values of all the components were recorded in the range of moderately positive attitudes. The behavioural component proved to be the weakest link of the attitude. Its dependence on the level of physical activity showed that girls who did not take physical activity and who took it at the low level represented negative behaviours, these being neutral in case of boys.
- The increase of the value of the medians of the attitudes to various areas of physical culture between the lowest and the highest categories of the level of physical activity was significant in 9 out of 10 studied areas, with the highest being recorded in the areas: own physical fitness, physical development, self-control, self-assessment and learning activities in physical culture.
Literature
- Bronikowski M. 2008. Postawy prosomatyczne mіodzieїy gimnazjalnej jako efekt interwencji w procesie wychowania fizycznego. Monografia no. 383, AWF Poznaс.
- Gуrna K. 2001. Przygotowanie mіodzieїy do uczestnictwa w kulturze fizycznej. AWF Katowice, pp. 80-81. 260-262.
- Grabowski H. 1999. Teoria fizycznej edukacji. WSiP, Warsaw.
- Krawczyk Z. 1983. Spoіeczno-kulturowe wartoњci sportu w њwietle badaс empirycznych. Wychowanie Fizyczne i Sport, no. 3, pp. 39-47.
- Osiсski W. 2011. Teoria wychowania fizycznego. AWF, Poznaс.
- Raglin J.S., Wilson G.S., Galper D. 2007. Exercise and its effects on mental health. (In:) Bouchard C., Blair S.N., Haskell W.L. (eds) Physical Activity and Health. Human Kinetics, IL, pp. 303-318.
- Winiarski R.W. 1995. Aktywnoњж sportowa mіodzieїy. Geneza – struktura –uwarunkowania. Wydawnictwo Monograficzne no. 66, AWF, Krakow.
Corresponding author: Professor Adam Jurczak
Department of Social Sciences, Academy of Physical Education, Cracow
Al. Jana Pawіa II 78, 31-557 Cracow, Poland,
Phone: 693 123 358; E-mail: adamjurczak11@gmail.com


 Журнал "THEORY AND PRACTICE