Analysis of Microvasculature of Athletic Throws Based on Speed Video Recording as a Method of Individualization of Training Process of Elite Athletes
Фотографии:
ˑ:
L.A. Khasin, associate professor, Ph.D., director of SRIIT, head of complex research group on track and field athletics
Scientific research institute of information technologies
Moscow state academy of physical culture, Malakhovka
Key words: elite athletes, athletic throws, high speed video recording, rational technique.
I assume it is advisable to consider two information groups of indices when assessing technical skills of elite athletes in athletic throws, weightlifting and other sports.
Considering technique as a system of movements for elite athletes, one can act in the following way: 1) register a sports movement with proper accuracy and keep searching for indices closely related to sports result. For example, in shot put the duration of certain phases and other values of space and time, kinematic and dynamic characteristics of movement can be such indices. Elite athletes can perform the above task in the following way: repeated registration of a movement executed by an athlete and determination of the phase structure and other parameters of this movement. The relations of some characteristics with result can be detected using the methods of mathematical statistics and other methods of data analysis and processing. In our case the movements were registered using high speed video recording. The relations with result were detected using the methods of mathematical statistics, including correlation analysis.
As an example, let us consider some characteristics of shot put performed by leading Russian and foreign athletes. These athletes used “in jump” technique of shot putting. Duration of the following phases was estimated: jump, rolling and final speed-up. Kinematical and dynamical parameters of athletes’ techniques, namely movements, speed and acceleration of the shot and athlete’s interaction with the shot were determined. The above factors were bound to video records. The correlation analysis was used to reveal the relations between movement characteristics and shot putting results.
The parameters of the second group were assigned for estimating the degree of movement “automatism”; the latter was estimated using standard deviations of the durations of phases. In my opinion, the automatism of movement is determined by the performance of athlete’s inter- and intramuscular coordination, and by the perfection of the system that controls this coordination, including control program, feedback, etc.
The parameters important for result and estimation of automatism by video records were determined using the correlation analysis; descriptive statistics were formed for Olympic Games champion 2008 and 2012, World and European championships prize winner T. Maevsky, 2003 World champion and 2010 European champion, Olympic Games and World championship prize winner A. Mikhnevich, and multiple champion of Russia and 2008 Olympic Games finalist P. Sof’in. The video recording was carried out in 2009 at Moscow Open and Brothers Znamensky Memorial, and in 2013 at the World championship in Moscow. High speed video recording up to 500 FPS was used, that allowed to reveal the microstructure of movements. This rate provided high accuracy of the measurements of movements and phase durations; for instance, the accuracy of measurements of the latter parameter was 4 ms. Kinematical and dynamical parameters were calculated by means of movement approximation by a fifth degree polynomial.
The following phases were studied:
Т1 – jump duration (between lift-off and landing on right foot).
Т2 – time between right foot and left foot landings (rolling phase)
Т3 – time between left foot landing and left foot lift-off (support phase).
Т4 – time between left foot lift-off and shot throwing (unsupported phase).
Т5 – time between left foot landing and shot throwing (final speed-up).
Т6 – total time between jump start and shot throwing.
The distance of shot put in a try was considered as a result.
Let us consider the video records of athletes’ movements, the results of correlation analysis, and the descriptive statistics.
Table 1. Descriptive statistics according to T. Maevsky’s phase structure and results
|
|
Valid N |
Mean |
Median |
Minimum |
Maximum |
Std.Dev. |
Std err |
|
Result |
4 |
20,66750 |
20,69500 |
20,30000 |
20,98000 |
0,329987 |
0,164994 |
|
Т1 |
4 |
0,13450 |
0,13400 |
0,11800 |
0,15200 |
0,015351 |
0,007676 |
|
Т2 |
4 |
0,09050 |
0,09100 |
0,07600 |
0,10400 |
0,012152 |
0,006076 |
|
Т3 |
4 |
0,21650 |
0,21500 |
0,204000 |
0,23200 |
0,011818 |
0,005909 |
|
Т4 |
4 |
0,05200 |
0,05500 |
0,03600 |
0,06200 |
0,011431 |
0,005715 |
|
Т5 |
4 |
0,26850 |
0,26900 |
0,26200 |
0,27400 |
0,005000 |
0,002500 |
|
Т6 |
4 |
0,49350 |
0,49000 |
0,46800 |
0,52600 |
0,024515 |
0,012258 |
Table 2. Correlation analysis of T. Maevsky’s phase durations and results (n=4)
|
|
Result, m |
T1 ,s |
T2 ,s |
T3 ,s |
T4 ,s |
T5 ,s |
T6 ,s |
|
Result, m |
1,0000 |
,8426 |
,2132 |
,9099 |
-,8024 |
,3162 |
,6978 |
|
p= --- |
p=,157 |
p=,787 |
p=,090 |
p=,194 |
p=,684 |
p=,302 |
|
|
Т1 ,s |
-,8426 |
1,0000 |
,7058 |
,5935 |
-,6382 |
-,0565 |
,9645 |
|
p=,157 |
p= --- |
p=,294 |
p=,407 |
p=,362 |
p=,944 |
p=,035 |
|
|
Т2 ,s |
,2132 |
,7058 |
1,0000 |
-,1230 |
-,0960 |
-,5102 |
,8336 |
|
p=,787 |
p=,294 |
p= --- |
p=,877 |
p=,904 |
p=,490 |
p=,166 |
|
|
Т3 ,s |
,9099 |
,5935 |
-,1230 |
1,0000 |
-,9080 |
,2877 |
,3693 |
|
p=,090 |
p=,407 |
p=,877 |
p= --- |
p=,092 |
p=,712 |
p=,631 |
|
|
Т4 ,s |
-,8024 |
-,6382 |
-,0960 |
-,9080 |
1,0000 |
,1400 |
-,4187 |
|
p=,198 |
p=,362 |
p=,904 |
p=,092 |
p= --- |
p=,860 |
p=,581 |
|
|
Т5 ,s |
,31625 |
-,0565 |
-,5102 |
,2877 |
,1400 |
1,0000 |
-,0843 |
|
p=,684 |
p=,944 |
p=,490 |
p=,712 |
p=,860 |
p= --- |
p=,916 |
|
|
Т6 ,s |
,6978 |
,9645 |
,8336 |
,3693 |
-,4187 |
-,0843 |
1,0000 |
|
p=,302 |
p=,035 |
p=,166 |
p=,631 |
p=,581 |
p=,916 |
p= --- |
Table 3. Descriptive statistics on A. Mikhnevich’s phase structure and results
|
|
Valid N |
Mean |
Median |
Minimum |
Maximum |
Variance |
Std.Dev. |
Std err |
|
Result |
5 |
20,66000 |
20,45000 |
20,41000 |
21,02000 |
0,102350 |
0,319922 |
0,143073 |
|
Т1 |
5 |
0,12160 |
0,12000 |
0,10800 |
0,13600 |
0,000149 |
0,012198 |
0,005455 |
|
Т2 |
5 |
0,04720 |
0,04000 |
0,03600 |
0,06000 |
0,000139 |
0,011798 |
0,005276 |
|
Т3 |
5 |
0,19800 |
0,19800 |
0,19200 |
0,20400 |
0,000020 |
0,004472 |
0,002000 |
|
Т4 |
5 |
0,04800 |
0,04800 |
0,04400 |
0,05200 |
0,000008 |
0,002828 |
0,001265 |
|
Т5 |
5 |
0,24600 |
0,24800 |
0,23600 |
0,25200 |
0,000036 |
0,006000 |
0,002683 |
|
Т6 |
5 |
0,41700 |
0,42000 |
0,40400 |
0,42400 |
0,000059 |
0,007681 |
0,003435 |
Table 4. Correlation analysis of A. Mikhnevich’s phase durations and results (n=5)
|
|
Result, m |
T1 ,s |
T2 ,s |
T3 ,s |
T4 ,s |
T5 ,s |
T6 ,s |
|
Result, m |
1,0000 |
-,8687 |
,9935 |
-,3914 |
-,6741 |
-,6095 |
-,5982 |
|
p= --- |
p=,056 |
p=,001 |
p=,515 |
p=,212 |
p=,275 |
p=,287 |
|
|
Т1 ,s |
-,8687 |
1,0000 |
-,9061 |
,4399 |
,8115 |
,7105 |
,7044 |
|
p=,056 |
p= --- |
p=,034 |
p=,458 |
p=,095 |
p=,179 |
p=,184 |
|
|
Т2 ,s |
,9935 |
-,9061 |
1,0000 |
-,3411 |
-,7192 |
-,5933 |
-,5848 |
|
p=,001 |
p=,034 |
p= --- |
p=,574 |
p=,171 |
p=,292 |
p=,300 |
|
|
Т3 ,s |
-,3914 |
,4399 |
-,3411 |
1,0000 |
,3162 |
,8944 |
,8733 |
|
p=,515 |
p=,458 |
p=,574 |
p= --- |
p=,604 |
p=,041 |
p=,053 |
|
|
Т4 ,s |
-,6741 |
,8115 |
-,7192 |
,3162 |
1,0000 |
,7071 |
,7365 |
|
p=,212 |
p=,095 |
p=,171 |
p=,604 |
p= --- |
p=,182 |
p=,156 |
|
|
Т5 ,s |
-,6095 |
,7105 |
-,5933 |
,8944 |
,7071 |
1,0000 |
,9981 |
|
p=,275 |
p=,179 |
p=,292 |
p=,041 |
p=,182 |
p= --- |
p=,000 |
|
|
Т6 ,s |
-,5982 |
,7044 |
-,5848 |
,8733 |
,7365 |
,9981 |
1,0000 |
|
p=,287 |
p=,184 |
p=,300 |
p=,053 |
p=,156 |
p=,000 |
p= --- |
As can be seen in Table 4, there is a significant coefficient of the correlation between the result and the jump phase duration (р = 0,056), and between the rolling time and the result (р = 0,001). The standard errors of jump and rolling phase durations are 0,012, whereas the average time of jump phase is 0,12, i.e. the standard error of the jump phase duration is 10% of the average; the average time of rolling phase is 0,047, i.e. the standard error of this phase is 25% of the average. The standard errors of the support and the unsupported phases are 2 and 6% of the average, respectively, and the standard error of the final speed-up is less than 2% of the average time of this phase. Therefore, there are critical phases which essentially affect the results of an elite athlete. The shorter jump phase, the better the results are, and the longer rolling phase, the better the results are too. It should be noted that for the last athlete a reverse dependence is observed: shorter rolling time enhances higher results. At the same time, the durations of these phases are characterized by the highest standard errors, and this is very important. The variability of the rolling phase reaches 25%, i.e. the athlete searches for the time necessary for the first two phases. Apparently the athlete revises his action plan, because the rolling phase lasts for about 0,05 s, and the motion can be considered as ballistic one without any feedback. In the case of A. Mikhnevich one can assume that due to the very short rolling phase, the athlete did not have enough time to prepare for the final phases. Perhaps, the left side of the body was “tensed” insufficiently.
A high stability of phase durations was shown by T. Maevsky. It should be noted that the athlete has kept constant phase structure of movements: in 2009 and 2013 the phase durations were virtually identical, though the athlete’s weight had grown by more than 10 kg in this period of time.
Table 5. Descriptive statistics on P. Sof’in’s phase structure and results
|
|
Valid N |
Mean |
Median |
Minimum |
Maximum |
Std.Dev. |
Std err |
|
Result |
5 |
19,91200 |
19,87000 |
19,39000 |
20,80000 |
0,569052 |
0,254488 |
|
Т1 |
5 |
0,14840 |
0,15200 |
0,13400 |
0,16000 |
0,010334 |
0,004622 |
|
Т2 |
5 |
0,12760 |
0,13000 |
0,08400 |
0,16000 |
0,028263 |
0,012640 |
|
Т3 |
5 |
0,21520 |
0,20600 |
0,19600 |
0,26000 |
0,025946 |
0,011603 |
|
Т4 |
5 |
0,03050 |
0,03050 |
0,02200 |
0,04000 |
0,006982 |
0,003122 |
|
Т5 |
5 |
0,24040 |
0,23400 |
0,20000 |
0,30000 |
0,036453 |
0,016302 |
|
Т6 |
5 |
0,52700 |
0,52700 |
0,50800 |
0,54400 |
0,012845 |
0,005745 |
Table 6. Correlation analysis of P. Sof’in’s phase durations and results (n=5)
|
|
Result , m |
T1 ,s |
T2 ,s |
T3 ,s |
T4 ,s |
T5 ,s |
T6 ,s |
|
Result, m |
1,0000 |
,2362 |
-,3932 |
-,1170 |
-,0551 |
-,3828 |
-,1519 |
|
p= --- |
p=,702 |
p=,513 |
p=,851 |
p=,930 |
p=,525 |
p=,807 |
|
|
Т1 ,s |
,2362 |
1,0000 |
-,7936 |
,4714 |
,8685 |
,4375 |
,6591 |
|
p=,702 |
p= --- |
p=,109 |
p=,423 |
p=,056 |
p=,461 |
p=,226 |
|
|
Т2 ,s |
-,3932 |
-,7936 |
1,0000 |
-,8065 |
-,6746 |
-,6666 |
-,5344 |
|
p=,513 |
p=,109 |
p= --- |
p=,099 |
p=,212 |
p=,219 |
p=,354 |
|
|
Т3 ,s |
-,1170 |
,4714 |
-,8065 |
1,0000 |
,5716 |
,9583 |
,5611 |
|
p=,851 |
p=,423 |
p=,099 |
p= --- |
p=,314 |
p=,010 |
p=,325 |
|
|
Т4 ,s |
-,0551 |
,8685 |
-,6746 |
,5716 |
1,0000 |
,5879 |
,9417 |
|
p=,930 |
p=,056 |
p=,212 |
p=,314 |
p= --- |
p=,297 |
p=,017 |
|
|
Т5 ,s |
-,3828 |
,4375 |
-,6666 |
,9583 |
,5879 |
1,0000 |
,5798 |
|
p=,525 |
p=,461 |
p=,219 |
p=,010 |
p=,297 |
p= --- |
p=,305 |
|
|
Т6 ,s |
-,1519 |
,6591 |
-,5344 |
,5611 |
,9417 |
,5798 |
1,0000 |
|
p=,807 |
p=,226 |
p=,354 |
p=,325 |
p=,017 |
p=,305 |
p= --- |
The analysis of P. Sof’in’s phase structure showed weak correlations between the results and phase durations, and a lower level of the stability indices as compared to T. Maevsky and A. Mikhnevich, (Table 6). Significant differences in the kinematical and dynamical parameters of movements are also observed. Let us consider these differences by comparing T. Maevsky’s and P. Sof’in’s techniques using high speed video recording.
Figures 1–12 show the movement parameters, such as body inclination angle in the beginning of final speed-up, forces of interaction with the shot at various stages, points of maximum force application, and time and speed indices corresponding to them.
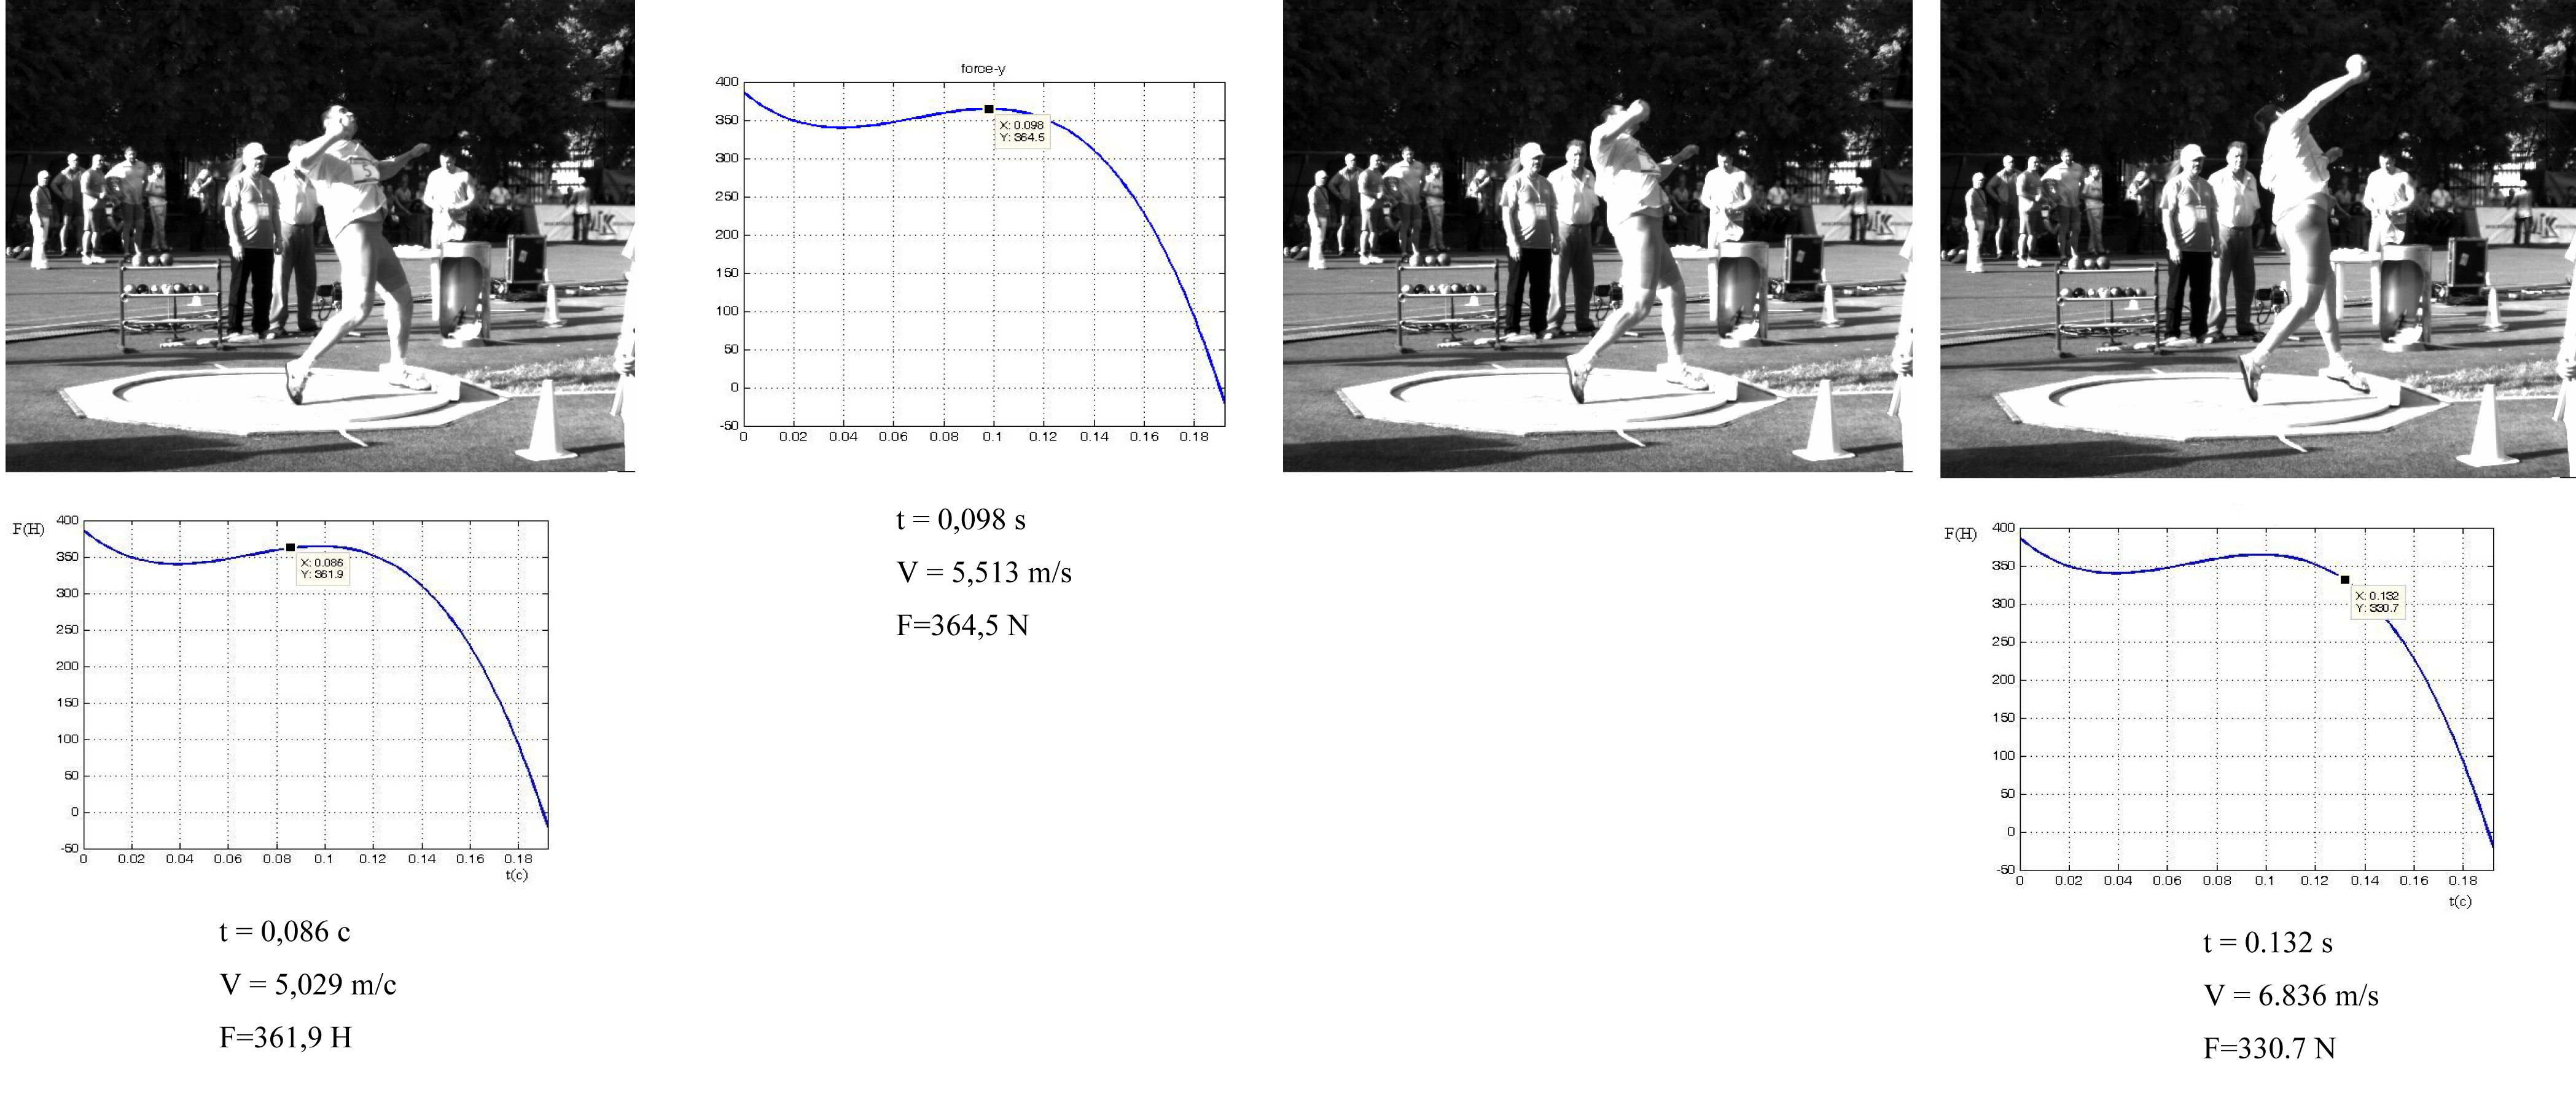
The postures of T. Maevsky and P. Sof’in are shown in figures 1 and 2. The former athlete’s vertical force curve at high angles of declination from the normal in the beginning of the final speed-up is shown in Figure 3. P. Sof’in opened early, and the angle with the normal in the beginning of final speed-up was smaller (Figure 4). The maximum vertical force was applied by P. Sof’in at earlier movement stages.
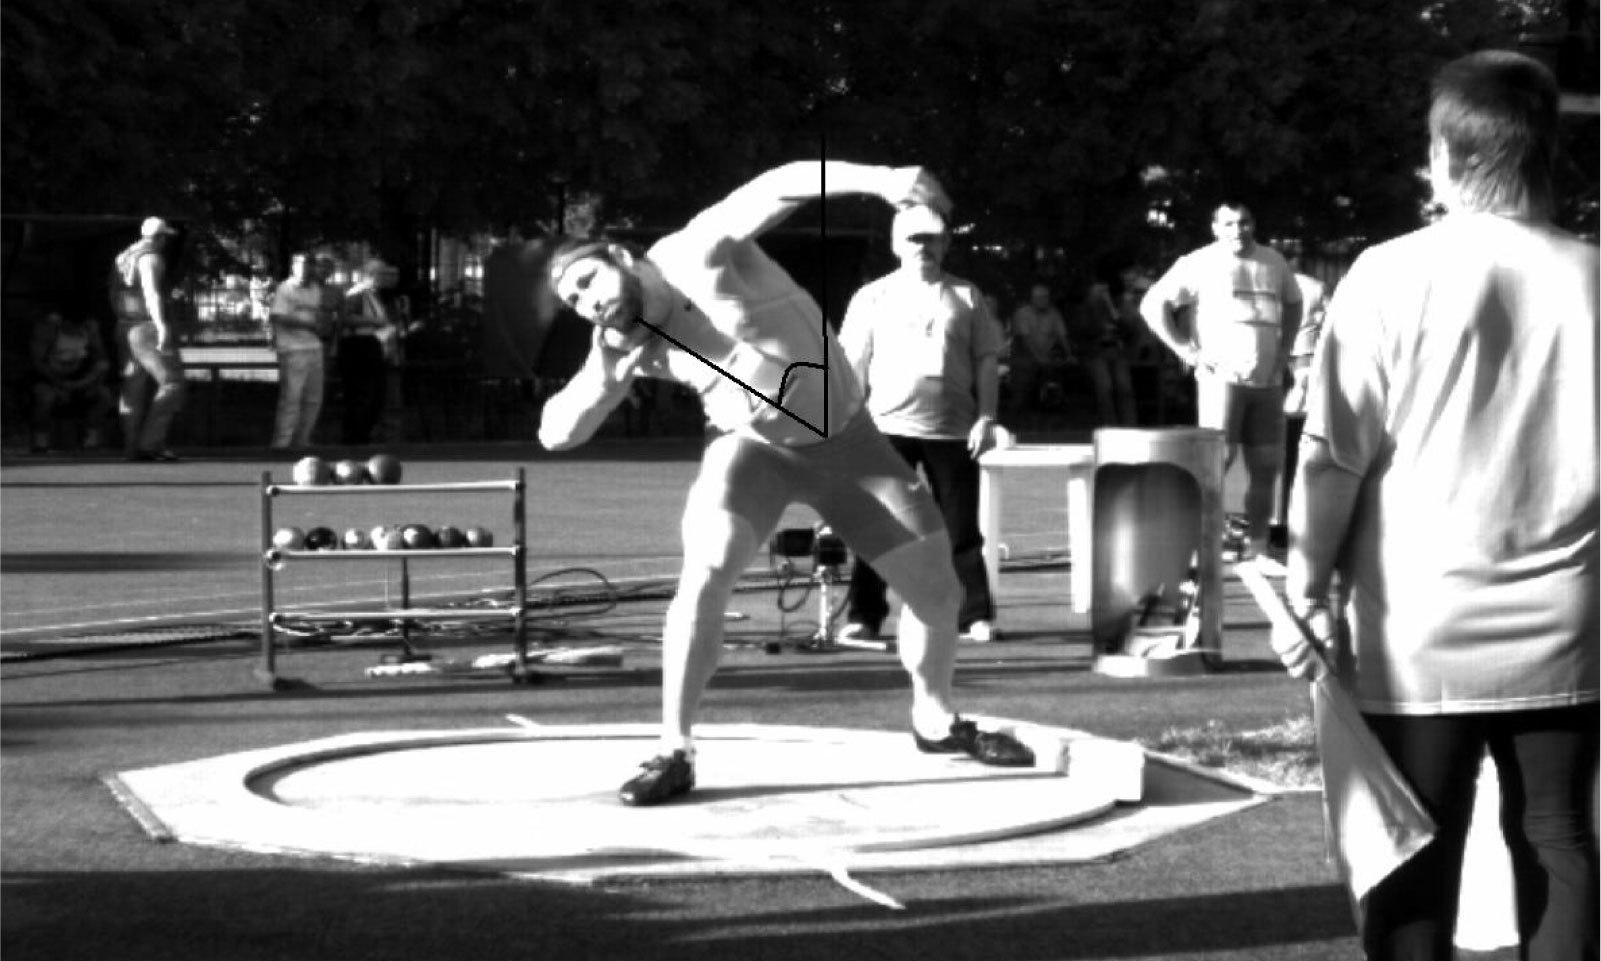
Fig. 1 – T. Maevsky in the beginning of final speed-up. The angle of the body declination is 49 degrees.
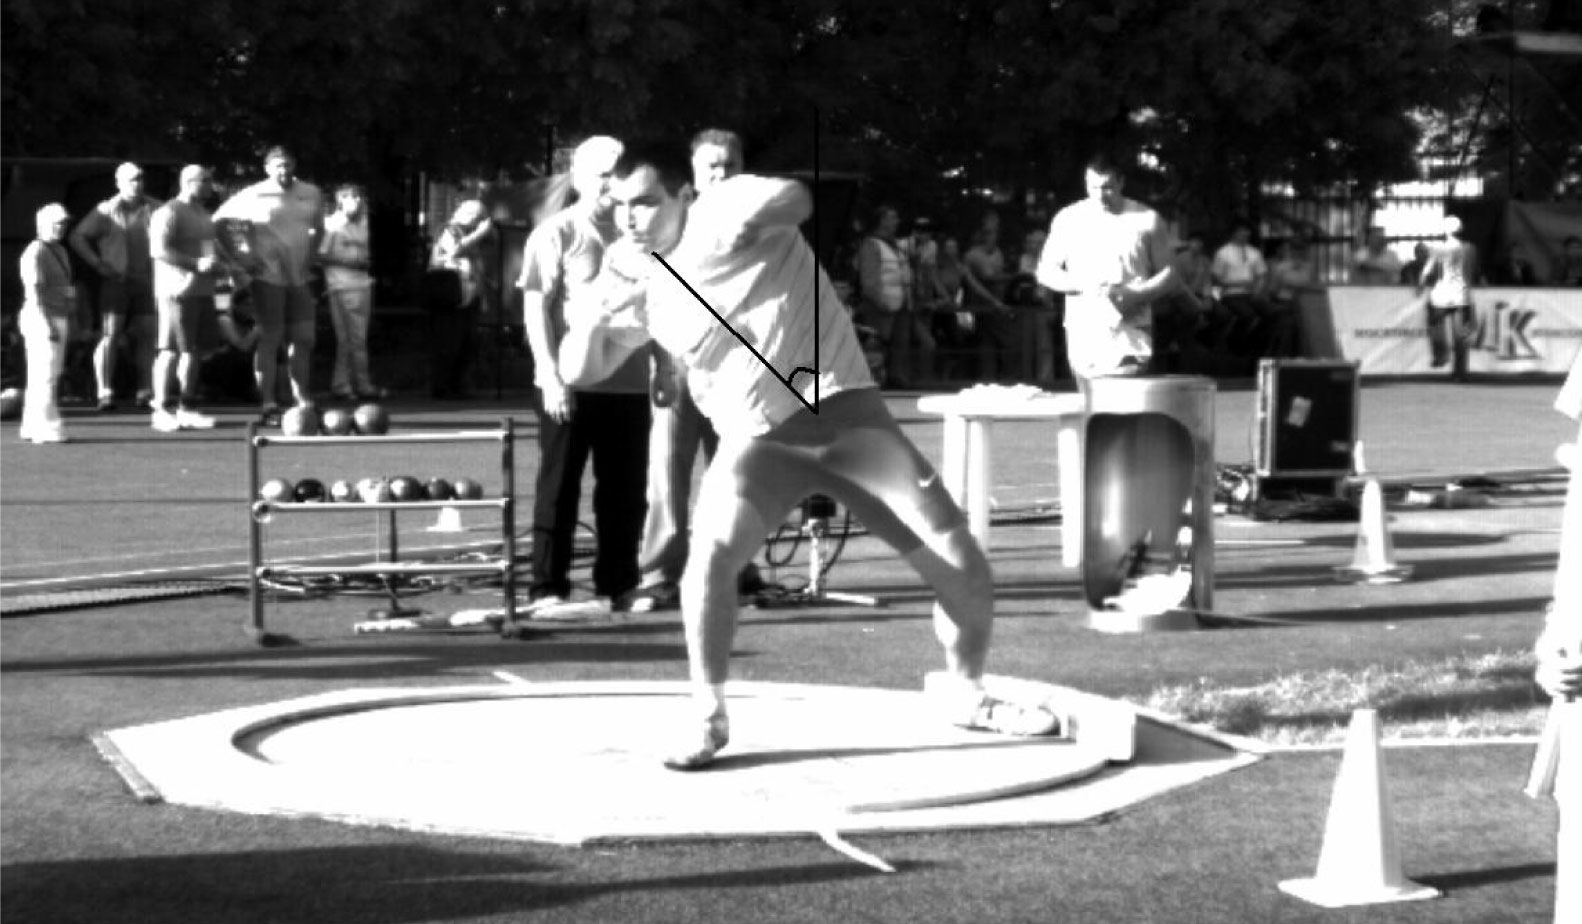
Fig. 2 – P. Sof’in in the beginning of final speed-up. The angle of body declination is 39 degrees.
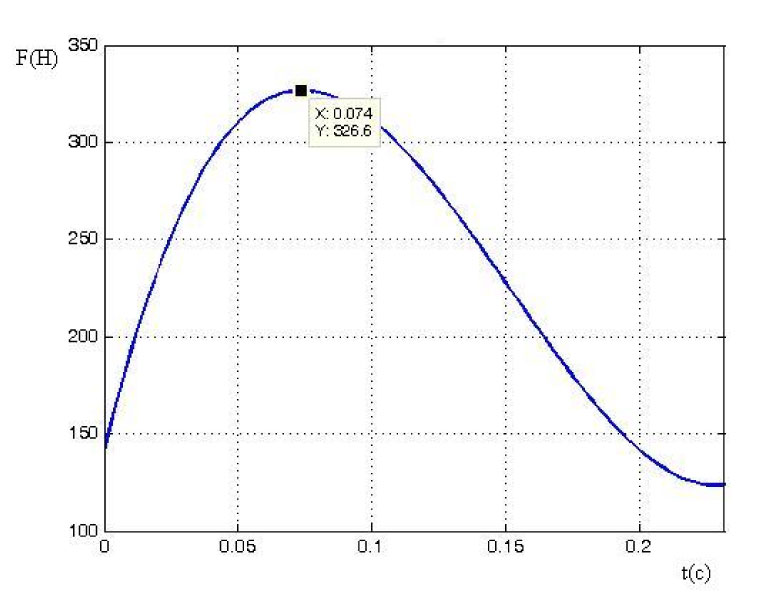
Fig. 3 – Upright force vs. time (T. Maevsky, final speed-up).
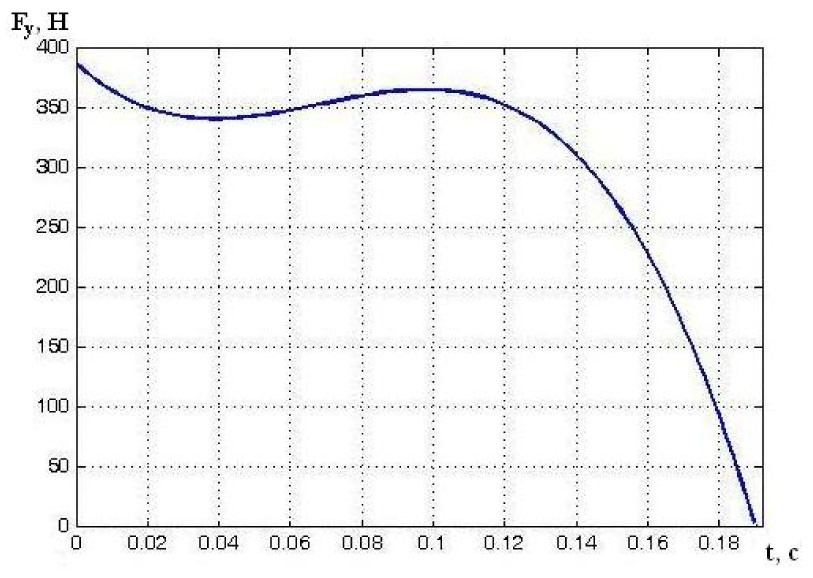
Fig. 4 – Upright force vs. time (P. Sof’in, final speed-up).
The first force peak is caused by P. Sofin’s body extension. The curve in figure 4 evidences about an early body extension. The position corresponding to the second force peak is shown in Figure 5. The athlete’s right arm is already straightened at the elbow. The force is generated mainly by body rotation about the longitudinal axis. P. Sof’in applies higher maximum force and has worse results compared to T. Maevsky, whereas he generates a lower force impulse which determines the shot put distance. This can be explained by an early arm straightening at the elbow, causing a movement reduction and an ineffective activity.
The extension of the time gap between maximum forces along Oy and Ox axes is a positive factor that characterizes the shot put technique.
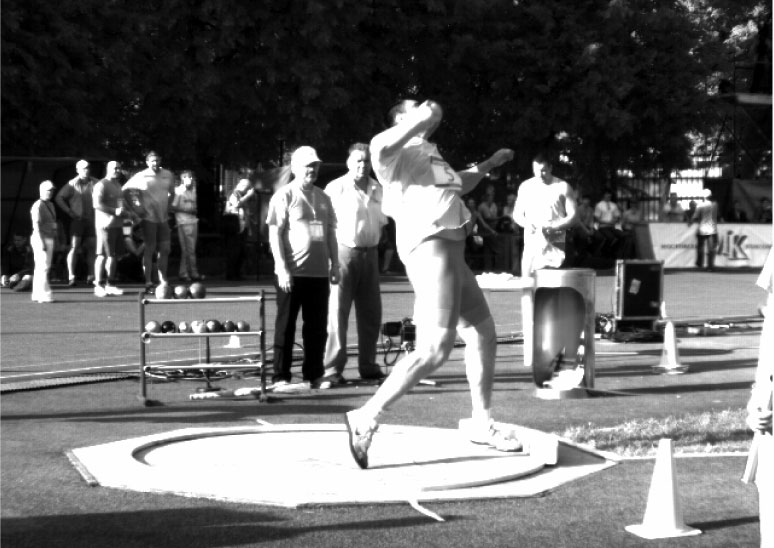
Fig. 5 – P. Sof’in: posture at the maximum force applying.
F = 634.9 N, t = 0.12 s, V = 9.66 m/s.
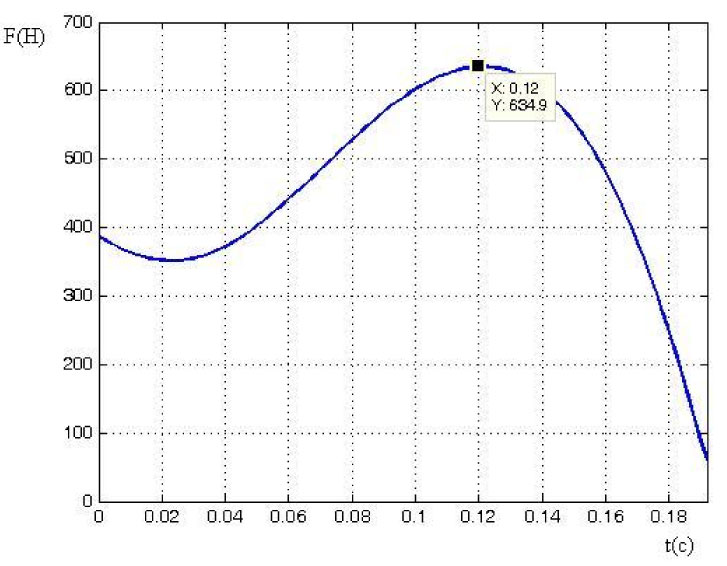
Fig. 6 – Athlete’s interaction with shot put vs. time.
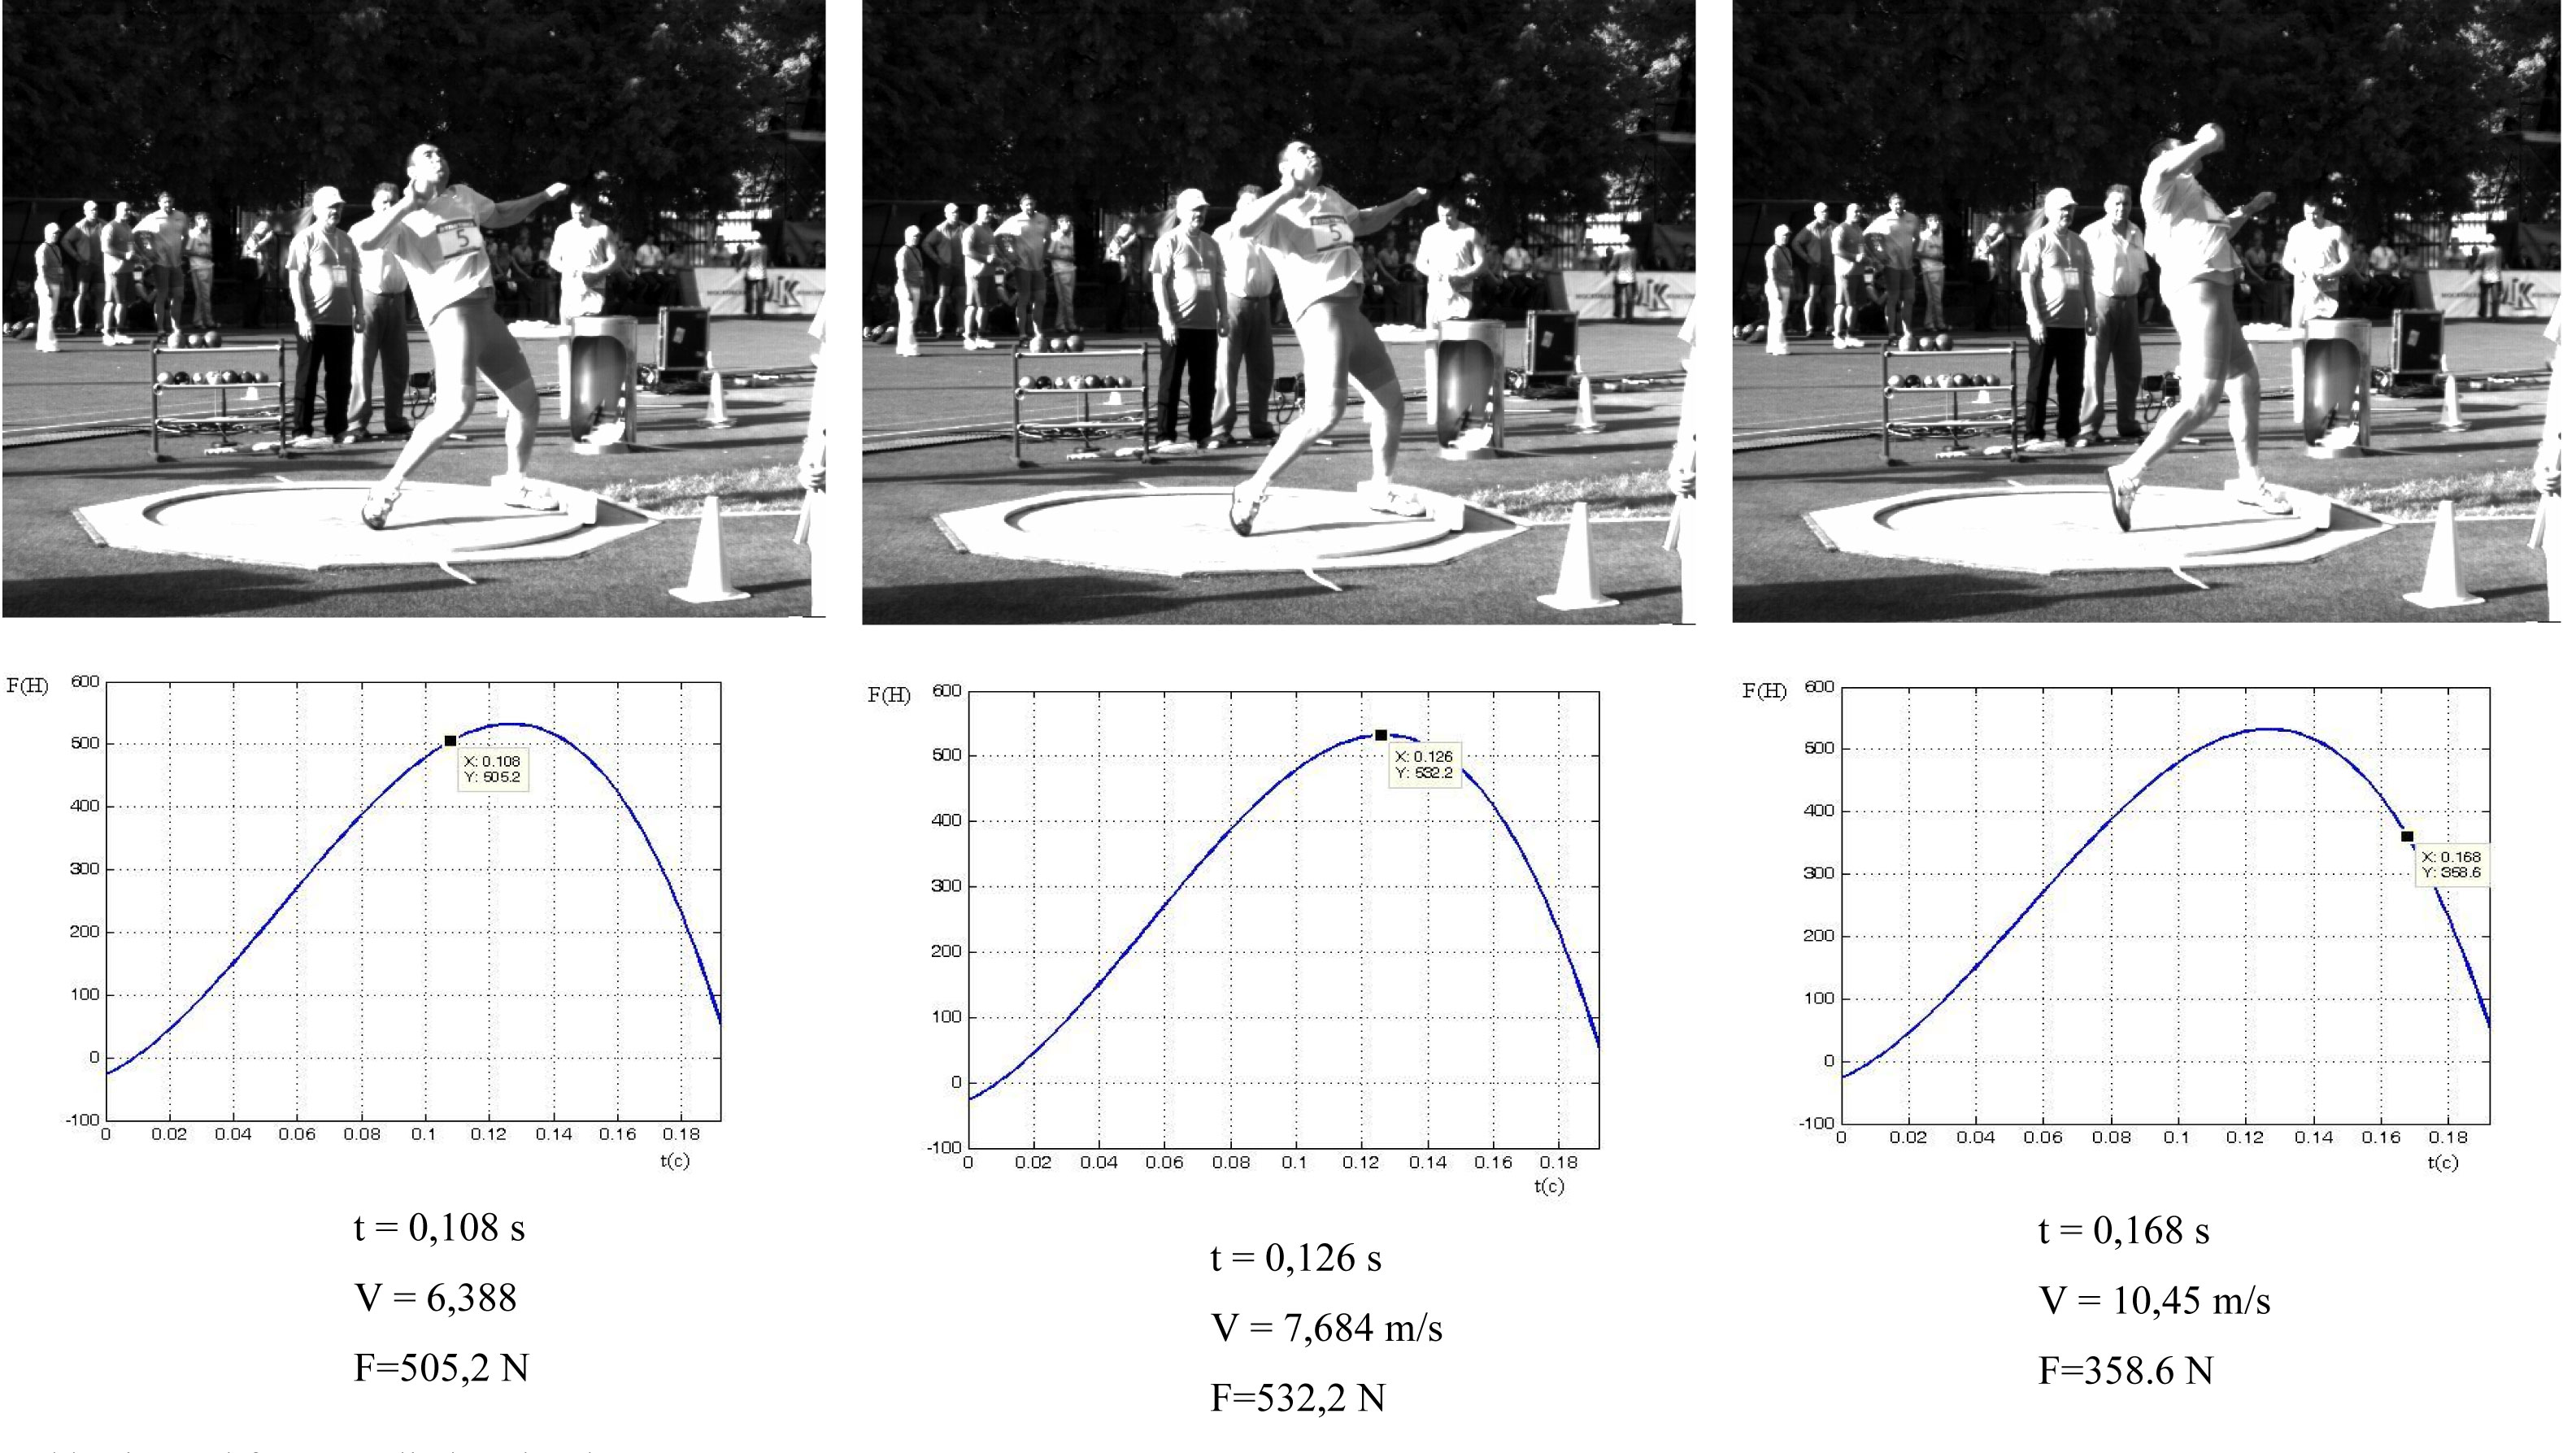
Taking T. Maevsky’s technique as an optimal one, the shot holding and arm straightening at the elbow should be performed in the way shown in Figures 9 – 12: the maximum forces along Ox and Oy axes are separated in time. The first force peak (along Oy axis) is provided by the body extension (Figure 12), and the second one (along Ox axis) – mainly by arm straightening at the elbow (Figure 11).
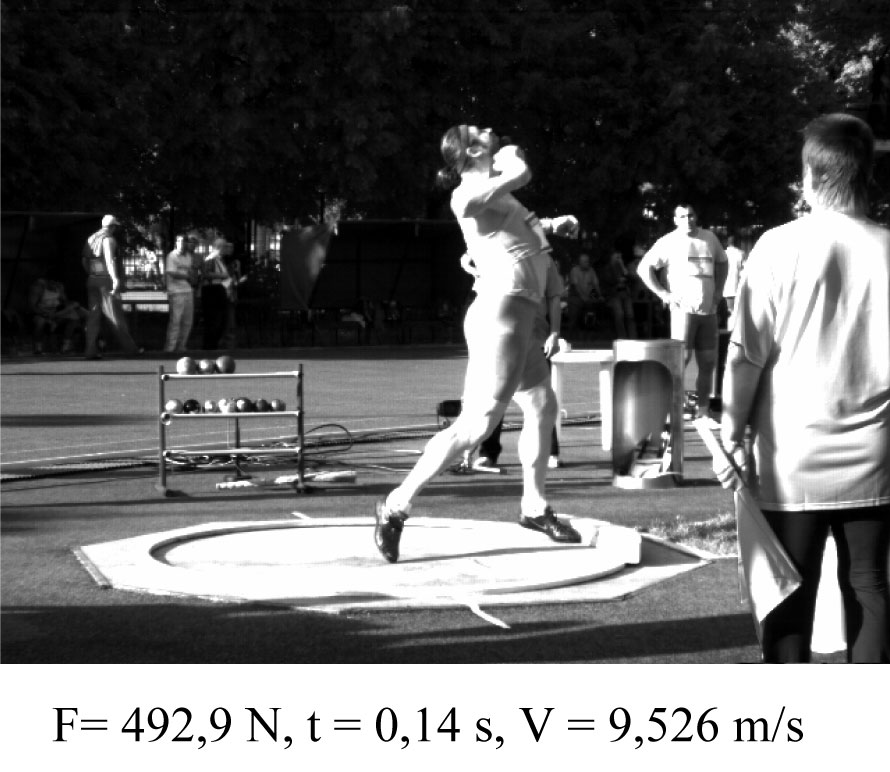
Fig. 9 – T. Maevsky: posture at the maximum force applying.
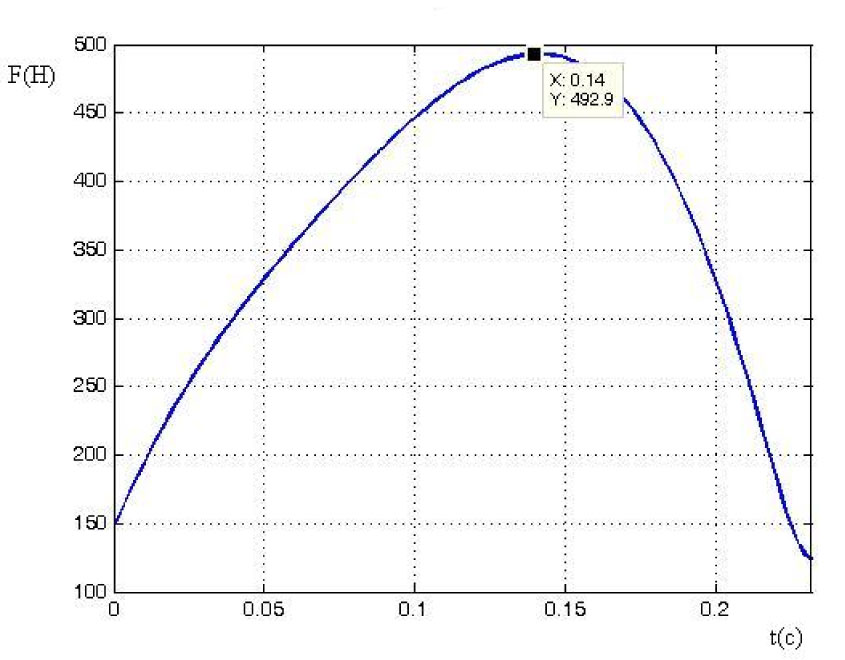
Fig. 10 – Athlete’s interaction with shot put vs. time.
The comparative analysis of the techniques of T. Maevsky and P. Sof’in, based on the high speed video records, showed that T. Maevsky used significantly higher angle of body declination (Figures 11–12). Maximum force was applied by T. Maevsky exactly at the start of arm straightening at the elbow, whereas P. Sof’in straightened his arm “in vain”. Besides, after the jump phase P. Sof’in’s knee joint noticeably flexed, causing a reduction in the speed of movement (Figure 11). T. Maevsky’s technique can be considered as more rational according to the general canons. P. Sof’in’s technical errors were caused largely by insufficient speed and force training. The high speed video recording and the mathematical methods of data processing allowed to elucidate these details and to calculate the above parameters.
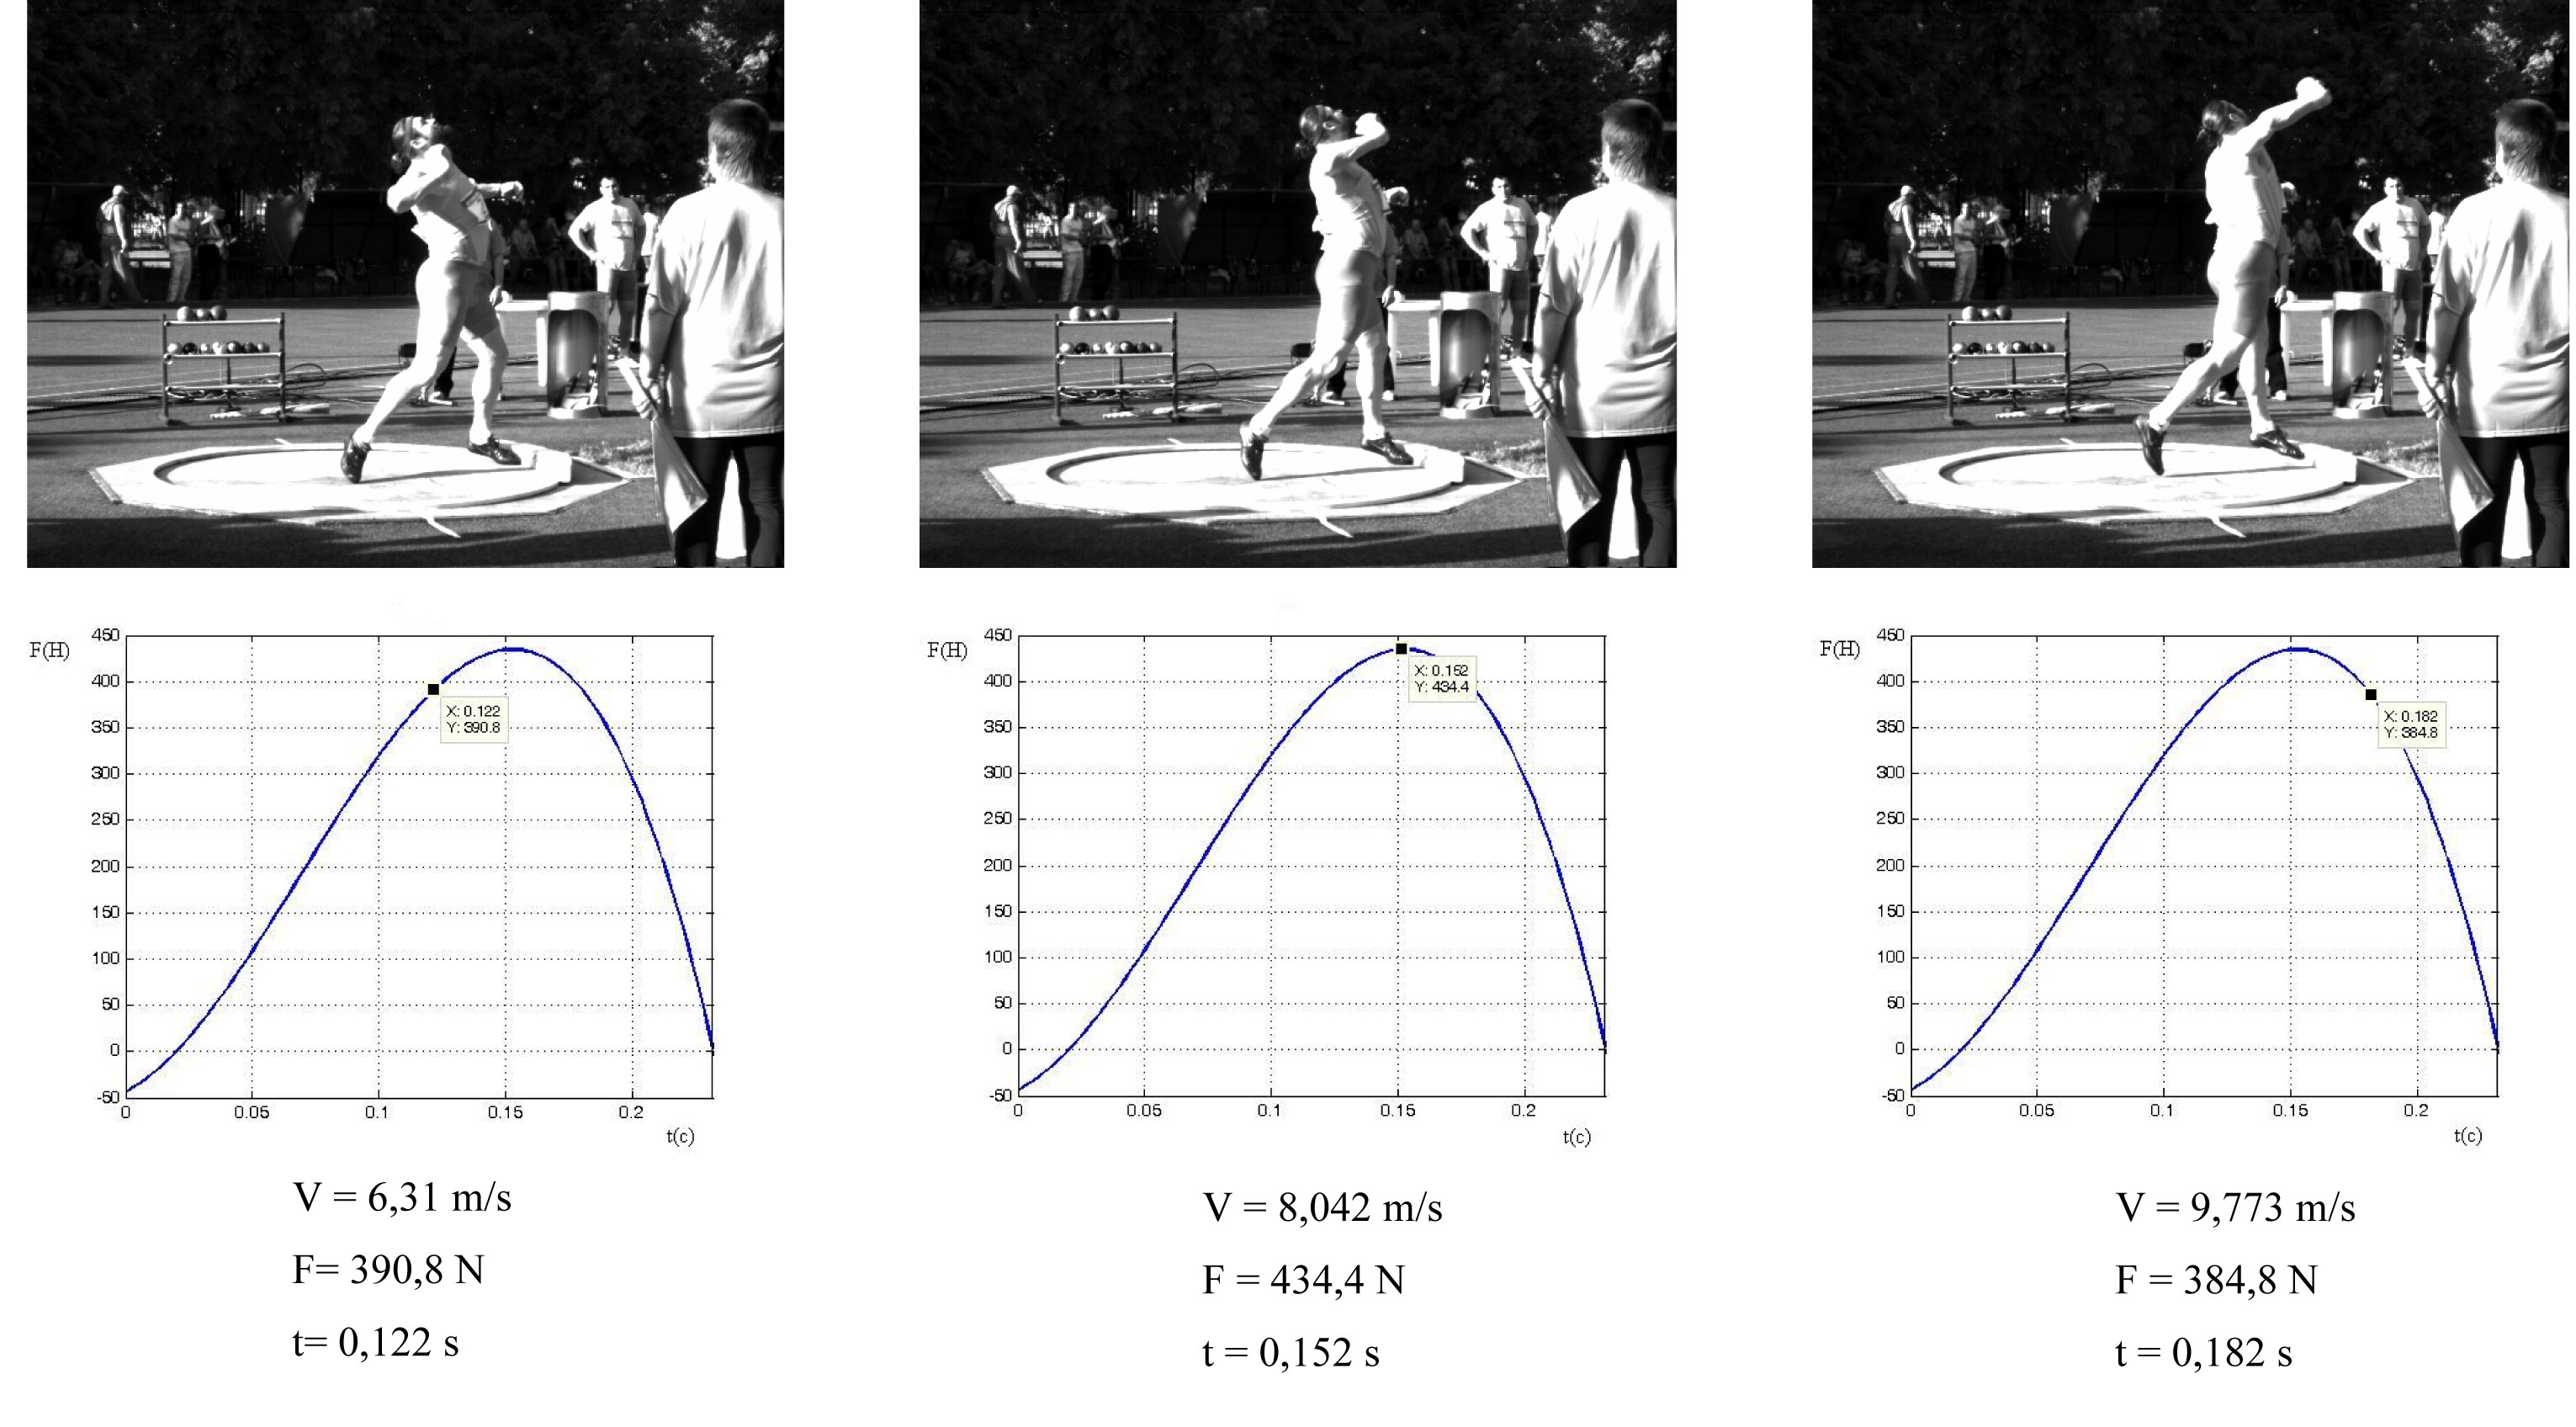
Fig. 11 – Athlete’s postures and horizontal force applied to the shot (T. Maevsky).
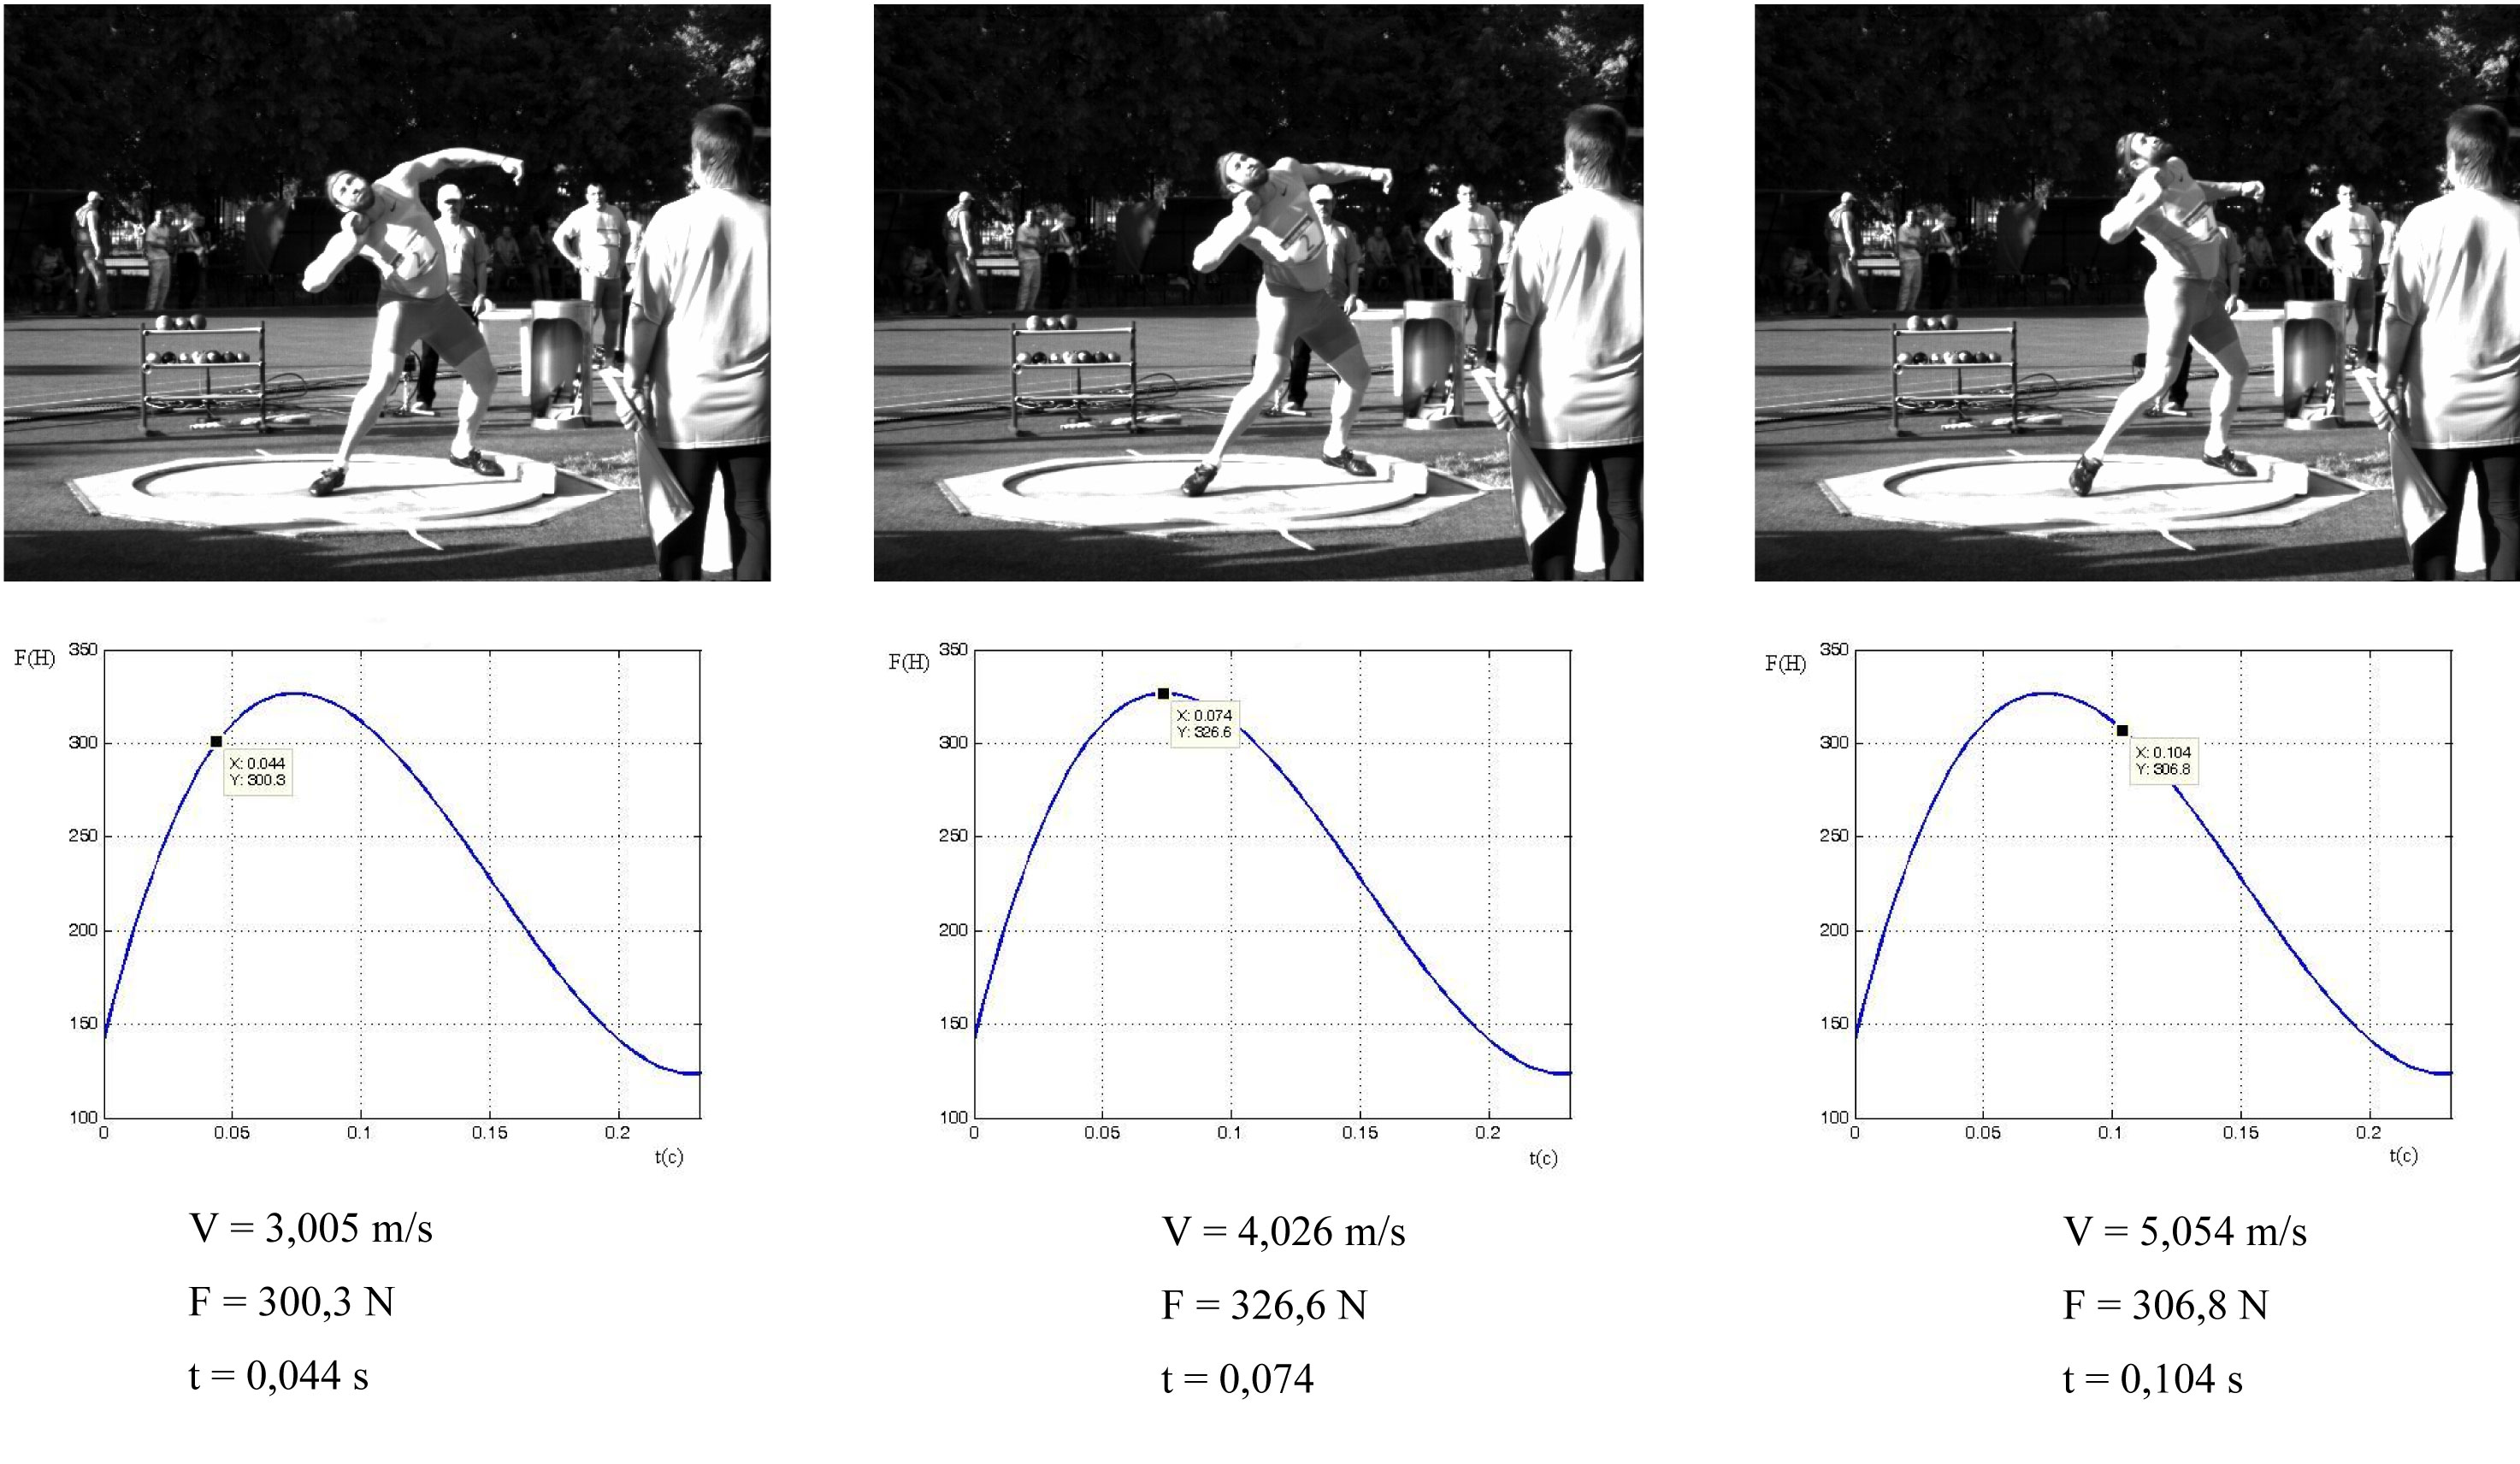
Fig. 12 – Athlete’s postures and vertical force applied to the shot (T. Maevsky).
It should be noted that athletes’ training can be adjusted owing to the calculation and analysis of dynamical parameters. We revealed the correlations between phase durations and results by means of high technologies. As we know, these correlations have not been mentioned in the scientific and methodical literature up to now. We found out also the relations between the kinematical/dynamical parameters and the results. The new facts and relations resulted from more accurate movement recording and more perfect data processing.
The diagnostic problem was solved above. At the same time, the high speed recording can be applied to the solution of a didactic problem consisting in the technique perfection. In our opinion, the technique can be adjusted by athlete’s targeted training. It can be briefly stated as:
1) Training aimed at the discerning time intervals as short as possible.
2) Performing standard movements in fixed time.
3) Showing to athlete a high speed record of his movements.
4) Applying shots of varying weight for different motor activities.
5) Performing movements that demand strong correlation between the temporal and space parameters.
Other types of exercises aimed at the correction of technical errors and technique regulation can be used as well.
In our opinion, the usage of high speed video recording and up-to-date mathematical techniques of data processing will significantly enhance biomechanical analysis and mastering of the technique of sports movement execution.
References
- Khasin, L.A. Fault diagnostics in weightlifting exercises based on high-speed video recording / L.A. Khasin // Teoriya i praktika fizicheskoy kultury. – 2013. – №1. – P. (In Russian)
- Khasin, L.A. Biomechanical analysis of weightlifter's technique in the classic jerk based on high speed video and computer modeling / L.A. Khasin // Teoriya i praktika fizicheskoy kultury. – 2013. – №11. – P. 100-104. (In Russian)
- Khasin, L.A. The microstructural analysis of the technique of highly skilled athletes on the example shot put (report) / L.A. Khasin // Final collection of All-Rus. theor.-pract. conf. with internat. particip. "Integrated support of elite athletes' training"(FRC ARSRIPhC). – 2013. – P. 98. (In Russian)
Corresponding author: niit1995@mail.ru


 Журнал "THEORY AND PRACTICE