Weight Movement in Elite Weightlifters in Competitive Conditions
Фотографии:

ˑ:
V.F. Skotnikov, professor, Ph.D.
A.A. Shalmanov, professor, Dr.Hab.
A.V. Panin, postgraduate of the faculty of biomechanics
Russian state university of physical culture, sport, youth and tourism (SCOLIPhC), Moscow
Key words: biomechanical monitoring, technical and physical skills, hardware-software complex.
Introduction. Most of researches in weightlifting were held mainly in vivo but in the recent years the interest has changed to studies of weightlifters' skills in top competitive conditions [1-5]. The value of findings of such researches is especially high, as they fix the state of athletes performing motor actions at the top of human abilities. The disadvantage is that measurement systems applied in them are mostly video recording and impede getting urgent information on athlete's state and use it in the on-line and routine biomechanical monitoring. Data processing is labour- and time-consuming. And the samples of examined athletes are usually small.
The process of data collection and processing can be accelerated thanks to specialized hardware and software complexes such as V-Scope VS-120 (Israel) and Weightlifting analyzer 3.0 (Germany), SCOLIPhC-2012 (Russia), which ensure getting results immediately after doing an exercise. Development and enhancement of these systems offers great opportunities to learn techniques and evaluate speed and strength skills of weightlifters, both during competition and training.
The purpose of the study was to allocate the rules of change of kinematic and dynamic indices of weight movement for elite athletes - representatives of different weight categories - in conditions of official competitions.
Materials and methods. To register the trajectory of the bar and to calculate the kinematic and dynamic parameters of its motion a specialized hardware-software complex was used which included a photo-camera «Canon», a marker fixed on the end of the bar, a laptop with software [6]. This complex is a part of our technique of biomechanical control of technical and speed-strength skills of weightlifters “SCOLIPhC-2012” [7].
Three competitions were filmed: the Weightlifting Russia Cup 2012 in Cheboksary, the Russian Championship and the XVII World Universiade 2013 in Kazan. The camera was mounted on the side of a weightlifting platform at the distance of 5.5 m, 4 m and 8 m from the end of the bar at the height of 1.5 m above the surface of the platform. The optical axis of the camera was perpendicular to the shooting surface. Frequency of shooting - 50 frames per second.
There were registered more than 1000 attempts in the snatch and the clean and jerk lifts in all weight categories for men and women. In the further processing the best attempts were selected of the athletes, who showed the results corresponding to the standards of Master of Sports (144 men and 81 women) and International Master of Sports (40 men and 66 women). The total number of examined athletes was 331 people (184 men and 147 women). Athletes’ characteristics are presented in Tables 1 and 2.
Table 1. Data for male weightlifters, representatives of different weight categories
|
№
|
Name of the indicator |
Weight category (kg) |
|||||||
|
56 n=13 |
62 n=17 |
69 n=16 |
77 n=30 |
85 n=25 |
94 n=31 |
105 n=26 |
+105 n=26 |
||
|
1. |
Body length (m) |
1,59±0,05 |
1,60±0,04 |
1,65±0,03 |
1,72±0,04 |
1,72±0,04 |
1,77±0,04 |
1,81±0,04 |
1,85±0,05 |
|
2. |
Body weight (kg) |
55,7±027 |
61,1±1,76 |
68,3±0,88 |
76,1±0,92 |
84,3±0,14 |
92,8±1,4 |
103,1±2,0 |
133,3±17,0 |
Table 2. Data for female weightlifters, representatives of different weight categories
|
№ |
Name of the indicator |
Weight category (kg) |
||||||
|
48 n=14 |
53 n=21 |
58 n=23 |
63 n=24 |
69 n=24 |
75 n=23 |
75+ n=18 |
||
|
1. |
Body length (m) |
1,51±0,07 |
1,53±0,03 |
1,57±0,03 |
1,63±0,05 |
1,66±0,05 |
1,65±0,06 |
1,72±0,07 |
|
2. |
Body weight (kg) |
47,5±0,3 |
52,2±0,7 |
57,4±0,7 |
62,1±1,1 |
67,4±1,5 |
73,6±1,5 |
96,7±14,4 |
The results of the measurement were processed using the developed software, enabling to display the graphs of changes in the vertical component of the force applied to the bar, vertical velocity of the apparatus and power. Additionally, you can see the position of an athlete at any time of the exercise and the barbell trajectory (Fig. 1).
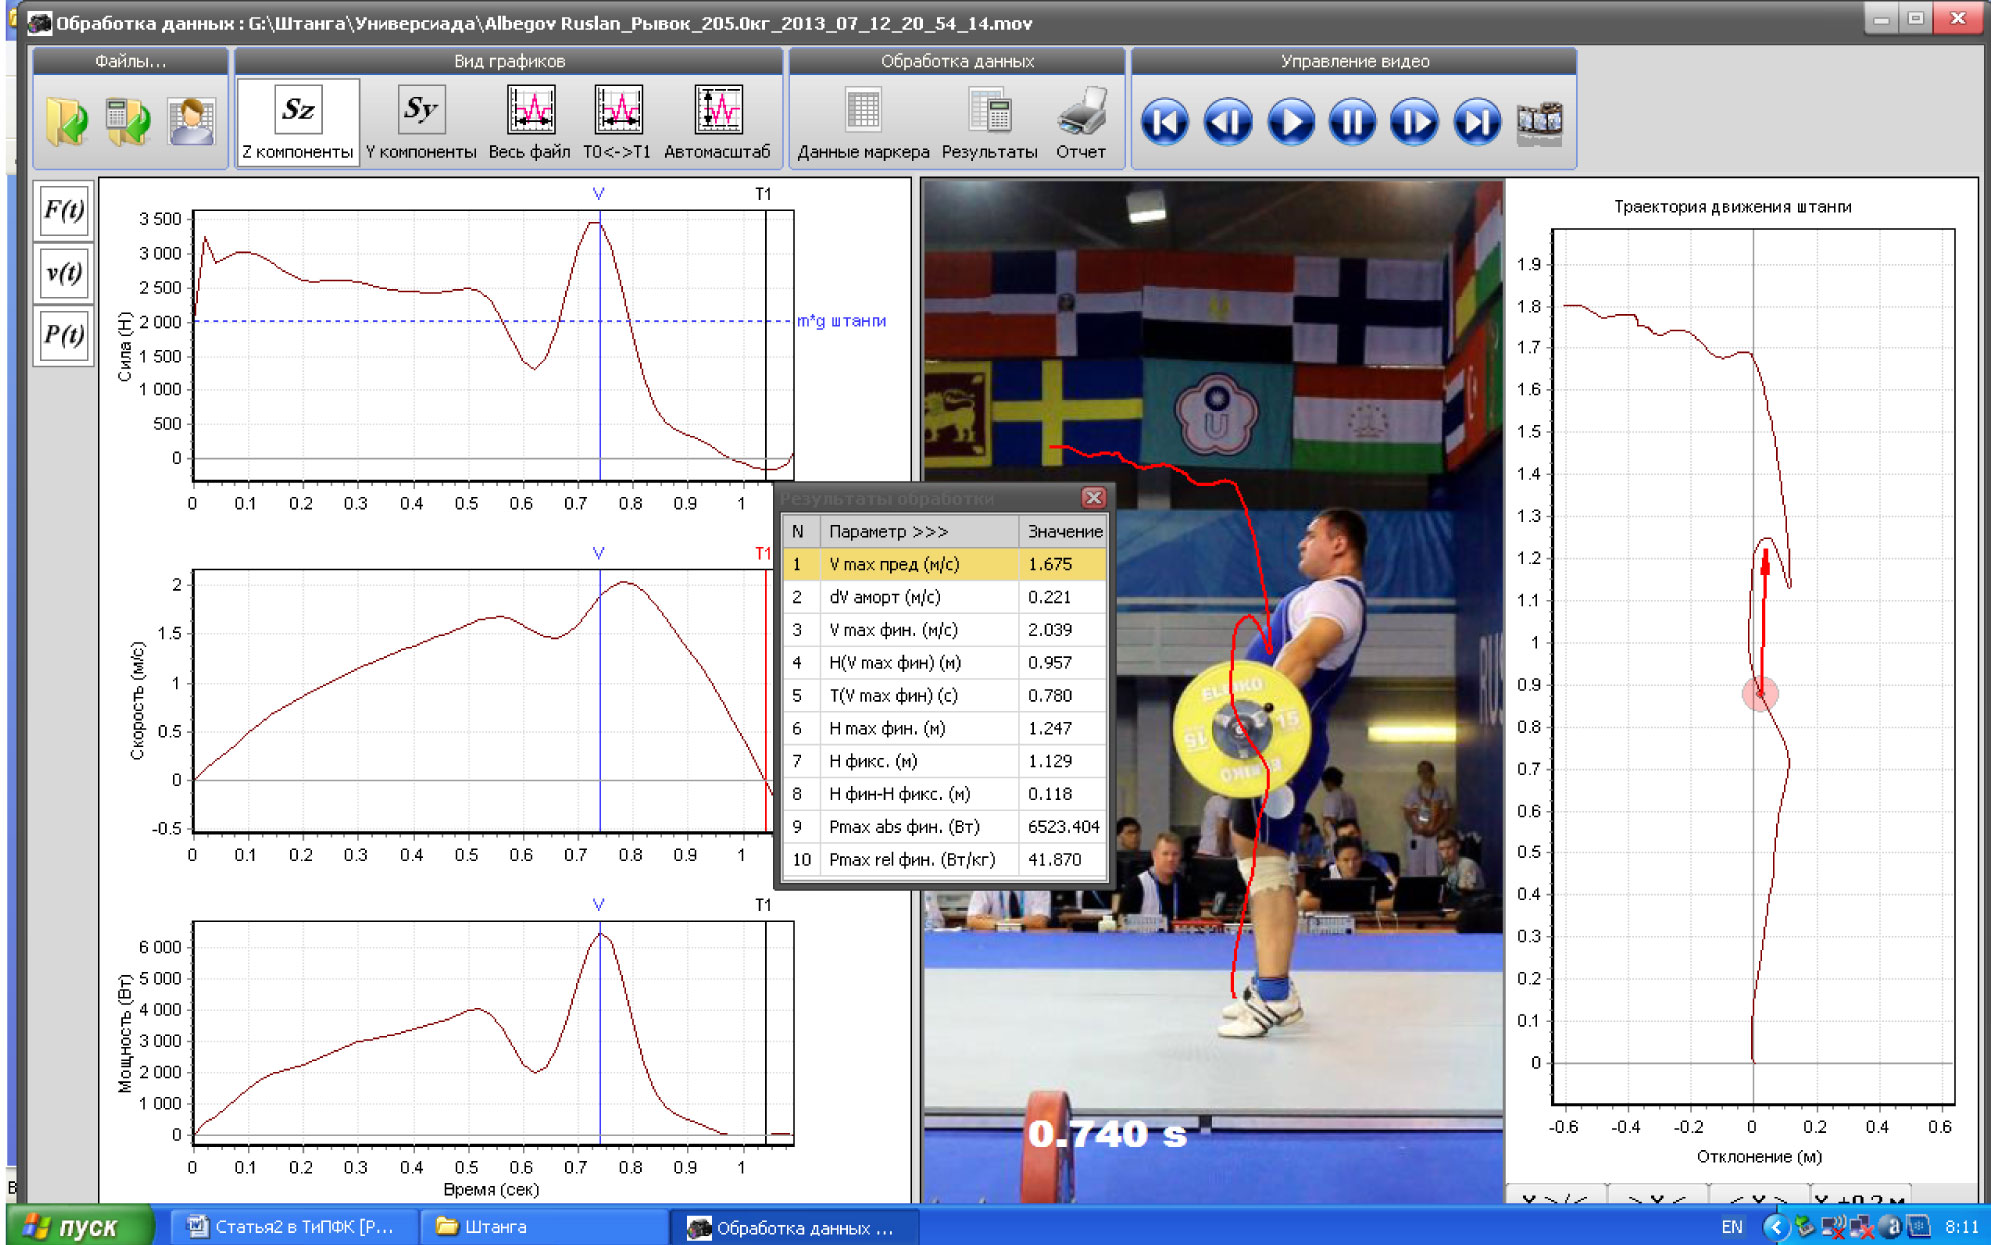
Fig. 1. Kinematic and dynamic characteristics of motion, athlete’s position at the time of maximum power during the final acceleration and trajectory of the apparatus during a snatch. An example.
The speed and acceleration of the bar were calculated by differentiating the coordinates of the apparatus. Power was calculated as a product of the force applied to the bar by the speed of the apparatus. The program automatically calculates and displays on the screen some kinematic and dynamic parameters of the bar movement. Since in this version of the method we only recorded the movement of the end of the barbell, but not the GCM, then because of the possible rotation of the apparatus with respect to the vertical axis we confined ourselves to studying the indicators that measure bar movement in the vertical direction.
Results and discussion.
The average data for different weight categories
Tables 3 and 4 show the kinematic and dynamic parameters of the bar movement in snatch and clean and jerk lifts in men in all eight weight categories. With the increase in athletes’ weight category, weight-height and results in classical exercises the bar speed tends to increase at the end of the pre-acceleration and the final acceleration of the apparatus, in a snatch, as well as during clean. Similarly there is change in the maximum speed of the bar when pushing it up from the chest in a jerk. These changes are particularly pronounced in heavyweight weightlifters (105 and +105 kg). For example, the maximum speed in the final acceleration in a snatch in athletes in the weight category of 56 kg is 1,25 ± 0,16 m/s, and in weightlifters of the weight category of +105 kg - 1,43 ± 0,17 m/s (p<0,01). Similar differences were observed in the acceleration of the bar to its maximum speed in this exercise - 0,77 ± 0,08 sec and 0,84 ± 0,07 sec, respectively (p<0,01).
As for the relative indices of the height of the lift in a snatch and a clean and jerk lifts, their values were not significantly different in weightlifters of different weight categories.
The maximum power developed by the athletes in a snatch and clean regularly increases with the increase in the weight category. For example, the maximum power when pushing the bar up from the chest in the weight category of 56 kg is 3452±767 watt, and in the weight category of 105 kg - 6,493±1,119 watt (Tab. 3).
Similar patterns in the change of the considered indices are observed in women (Tab. 5, 6). The difference is that the power developed by men in similar weight classes is on average more than the power developed by women. For example, in the weight category of 69 kg the power indicators in the snatch, in lifting the bar on the chest and in pushing it up from the chest in males were 3695 ± 587, 3376 ± 457 and 4764 ± 1384 watt, and in women, 2469 ± 586, 2469 ± 586 and 2913 ± 645 watt respectively (p <0,001).
Table 3. The average values and standard deviations of indicators of the bar movement in a snatch in athletes of different weight categories (men)
|
№
|
Name of the indicator |
Weight categories (kg) |
|||||||
|
56 n=13 |
62 n=17 |
69 n=16 |
77 n=30 |
85 n=25 |
94 n=31 |
105 n=26 |
+105 n=26 |
||
|
1. |
Result in the snatch (kg) |
101,2±8,3 |
118,6±11,6 |
137,1±7,7 |
139,7±12,4 |
150,3±12,4 |
161,3±12,6 |
169,4±15,1 |
178,7±18,4 |
|
2. |
Max. speed in the preliminary acceleration – V1 (m/s) |
1,25±0,16 |
1,15±0,19 |
1,21±0,20 |
1,35±0,18 |
1,34±0,16 |
1,33±0,17 |
1,40±0,18 |
1,43±0,17 |
|
3. |
Decrease in speed during amortization – ∆V1 (m/s) |
0,08±0,17 |
0,01±0,04 |
0,05±0,06 |
0,13±0,17 |
0,08±0,09 |
0,14±0,13 |
0,11±0,12 |
0,11±0,11 |
|
4. |
Max. speed in the final acceleration – Vmax (m/s) |
1,80±0,13 |
1,85±0,12 |
1,84±0,12 |
1,82±0,20 |
1,82±0,13 |
1,81±0,14 |
1,87±0,17 |
1,86±0,15 |
|
5. |
Time before Vmax - TVmax (sec) |
077±0,08 |
0,73±0,06 |
0,78±0,07 |
0,74±0,05 |
0,77±0,05 |
0,79±0,07 |
0,79±0,08 |
0,84±0,07 |
|
6. |
Rel. height at the time of Vmax – HVmaxOtn (%) |
0,44±0,03 |
0,44±0,03 |
0,44±0,03 |
0,44±0,04
|
0,45±0,03 |
0,43±0,03 |
0,46±0,05 |
0,47±0,03 |
|
7. |
Max. rel. height – HmaxOtn (%) |
0,60±0,04 |
0,60±0,03 |
0,60±0,03 |
0,59±0,06 |
0,59±0,04 |
0,58±0,04 |
0,61±0,04 |
0,62±0,04 |
|
8. |
Rel. height at the time of fixation – HfixOtn (%) |
0,50±0,03 |
0,50±0,04 |
0,49±0,03 |
0,49±0,05 |
0,50±0,04 |
0,49±0,04 |
0,52±0,05 |
0,53±0,03 |
|
9. |
Rel. difference (Hmax-Hfix) (%) |
0,10±0,02 |
0,10±0,02 |
0,11±0,03 |
0,10±0,02 |
0,09±0,03 |
0,10±0,02 |
0,10±0,02 |
0,11±0,10 |
|
10. |
Maximum power in the final acceleration – Pabs (W) |
2644±523 |
3063±526 |
3695±587 |
3619±762 |
3912±626 |
4243±853 |
4529±898 |
4740±1096 |
|
11. |
Maximum of the relative power in the final acceleration – Potn (W/kg) |
47,5±9,4 |
50,1±8,5 |
54,1±8,6 |
47,7±10,0 |
46,3±7,3 |
45,7±8,9 |
43,9±8,8 |
35,7±7,7 |
Table 4. The average values and standard deviations of indicators of the bar movement in a clean and jerk in athletes of different weight categories (men)
|
№
|
Name of the indicator |
Weight categories (kg) |
|||||||
|
56 n=13 |
62 n=17 |
69 n=16 |
77 n=30 |
85 n=25 |
94 n=31 |
105 n=26 |
+105 n=26 |
||
|
1. |
Result in a clean and jerk (kg) |
126,8±11,6 |
146,7±13,2 |
165,3±10,1 |
172,9±15,2 |
183,7±13,8 |
199,3±9,0 |
204,6±14,9 |
217,3±21,1 |
|
2. |
Maximum speed in the preliminary acceleration (m/s) |
1,13±0,12 |
1,07±0,21 |
0,99±0,30 |
1,24±0,14 |
1,19±0,16 |
1,17±0,34 |
1,28±0,20 |
1,28±0,14 |
|
3. |
Decrease in speed during amortization (m/s) |
0,19±0,17 |
0,15±0,12 |
0,12±0,09 |
0,25±0,14 |
0,25±0,11 |
0,27±0,17 |
0,32±0,18 |
0,31±0,17 |
|
4. |
Max. speed in the final acceleration (m/s) |
1,44±0,11 |
1,45±0,11 |
1,43±0,11 |
1,44±0,16 |
1,42±0,11 |
1,46±0,16 |
1,51±0,11 |
1,49±0,15 |
|
5. |
Time before the max. speed in the final acceleration (sec) |
0,79±0,09 |
0,80±0,09 |
0,83±0,09 |
0,74±0,09 |
0,77±0,11 |
0,77±0,14 |
0,76±0,11 |
0,81±0,12 |
|
6. |
Rel. height at the time of Vmax – HVmaxOtn (%) |
0,38±0,02 |
0,38±0,02 |
0,38±0,02 |
0,36±0,05 |
0,36±0,05 |
0,36±0,06 |
0,37±0,06 |
0,39±0,06 |
|
7. |
Max. rel. height – HmaxOtn (%) |
0,47±0,02 |
0,48±0,02 |
0,46±0,02 |
0,46±0,04 |
0,46±0,03 |
0,46±0,04 |
0,48±0,04 |
0,50±0,04 |
|
8. |
Rel. height at the time of fixation – HfixOtn (%) |
0,27 ±0,02 |
0,29 ±0,04 |
0,26±0,03 |
0,27±0,03 |
0,27±0,03 |
0,27±0,03 |
0,28±0,03 |
0,30±0,03 |
|
9. |
Rel. difference (Hmax-Hfix) (%) |
0,21±0,02 |
0,20±0,03 |
0,20±0,02 |
0,20±0,02 |
0,19±0,03 |
0,19±0,03 |
0,20±0,03 |
0,20±0,03 |
|
10. |
Maximum power in the final acceleration (W) |
2642±459 |
2987±466 |
3376±457 |
3553±523 |
3842±600 |
4430±1071 |
4655±832 |
4823±1038 |
|
11. |
Maximum of the relative power in the final acceleration (W/kg) |
47,5±8,3 |
48,9 ±7,5 |
49,5±7,7 |
46,8±7,0 |
45,6±7,0 |
46,9±11,2 |
45,1±7,9 |
36,4±7,9 |
|
12. |
Time of the squat while pushing the bar up from the chest (s) |
0,35±0,05 |
0,33±0,06 |
0,31 ±0,09 |
0,33±0,05 |
0,35±0,05 |
0,35±0,04 |
0,36±0,06 |
0,36±0,05 |
|
13. |
Relative depth of the squat while pushing the bar up from the chest (%) |
0,12±0,01 |
0,12±0,01 |
0,11±0,03 |
0,12±0,02 |
0,12±0,02 |
0,12±0,01 |
0,12±0,01 |
0,12±0,01 |
|
14. |
Maximum speed of the squat (m/s) |
-0,99 ±0,11 |
-0,97±0,05 |
-0,98±0,31 |
-1,11±0,18 |
-1,07±0,17 |
-1,08±0,14 |
-1,09±0,16 |
-1,05±0,12 |
|
15. |
Time of pushing the bar up from the chest (s) |
0,45±0,11 |
0,45±0,04 |
0,43 ±0,09 |
0,47±0,03 |
0,48±0,03 |
0,51±0,04 |
0,52±0,04 |
0,50±0,05 |
|
16. |
Maximum speed of pushing up from the chest (m/s) |
1,65±0,14 |
1,64±0,30 |
1,64±0,42 |
1,77±0,14 |
1,76±0,13 |
1,67±0,16 |
1,78±0,15 |
1,75±0,12 |
|
17. |
Max. power while pushing (watt) |
3452±767 |
4080±299 |
4764±1384 |
5375±929 |
5511±764 |
5472±1214 |
6394±1203 |
6493±1119 |
|
18. |
Max. rel. power while pushing (W/kg) |
62,0±13,8 |
66,7±18,8 |
69,8±20,2 |
70,8±12,7 |
65,4±8,9 |
57,9±12,7 |
61,9±11,6 |
49,4±10,0 |
Table 5. The average values and standard deviations of indicators of the bar movement in a snatch in athletes of different weight categories (women)
|
№ |
Name of the indicator |
Weight categories (kg) |
||||||
|
48 n=14 |
53 n=21 |
58 n=23 |
63 n=24 |
69 n=24 |
75 n=23 |
75+ n=18 |
||
|
1. |
Result in the snatch (kg) |
67,1±9,7 |
77,1±7,3 |
82,3±12,6 |
87,8±13,1 |
89,5±14,6 |
93,8±12,0 |
104,4±14,6 |
|
2. |
Max. speed in the preliminary acceleration – V1 (m/s) |
1,03±0,19 |
0,98±0,17 |
1,00±0,20 |
1,06±0,18 |
1,16±0,22 |
1,15±0,17 |
1,32±0,22 |
|
3. |
Decrease in speed during amortization – ∆V1 (m/s) |
0,03±0,05 |
0,01±0,03 |
0,04±0,06 |
0,03±0,05 |
0,06±0,11 |
0,11±0,14 |
0,11±0,10 |
|
4. |
Max. speed in the final acceleration – Vmax – Vmax (m/s) |
1,89±0,11 |
1,84±0,14 |
1,85±0,13 |
1,85±0,17 |
1,93±0,18 |
1,88±0,16 |
2,00±0,19 |
|
5. |
Time before Vmax - TVmax (sec) |
0,78±0,09 |
0,77±0,07 |
0,83±0,13 |
0,79±0,06 |
0,80±0,07 |
0,79±0,06 |
0,78±0,09 |
|
6. |
Rel. height at the time of Vmax – HVmaxOtn (%) |
0,46±0,04 |
0,45±0,04 |
0,44±0,03 |
0,43±0,04 |
0,46±0,05 |
0,46±0,04 |
0,46±0,04 |
|
7. |
Max. rel. height – HmaxOtn (%) |
0,63±0,05 |
0,61±0,05 |
0,61±0,03 |
0,59±0,06 |
0,63±0,06 |
0,62±0,05 |
0,64±0,05 |
|
8. |
Rel. height at the time of fixation – HfixOtn (%) |
0,51±0,04 |
0,49±0,04 |
0,50±0,04 |
0,48±0,05 |
0,50±0,05 |
0,51±0,05 |
0,55±0,06 |
|
9. |
Rel. difference (Hmax-Hfix) (%) |
0,12±0,03 |
0,12±0,03 |
0,11±0,02 |
0,12±0,04 |
0,12±0,03 |
0,11±0,03 |
0,09±0,03 |
|
10. |
Maximum power in the final acceleration – Pabs (W) |
1890±335 |
2040±351 |
2254±459 |
2345±457 |
2596±597 |
2625±507 |
3376±990 |
|
11. |
Maximum of the relative power in the final acceleration – Potn (W/kg) |
39,8±7,0 |
39,0±6,7 |
39,3±8,0 |
37,8±7,4 |
38,5±8,7 |
35,6±6,7 |
34,8±8,0 |
Table 6. The average values and standard deviations of indicators of the bar movement in a clean and jerk in athletes of different weight categories (women)
|
№ п/п |
Name of the indicator |
Weight categories (kg) |
||||||
|
48 n=15 |
53 n=21 |
58 n=23 |
63 n=24 |
69 n=24 |
75 n=23 |
75+ n=18 |
||
|
1. |
Result in a clean and jerk (kg) |
84,9±12,3 |
98,5±13,0 |
102,6±15,1 |
107,3±15,0 |
110,8±16,8 |
116,0±16,5 |
132,2±17,7 |
|
2. |
Maximum speed in the preliminary acceleration (m/s) |
0,86±0,27 |
0,84±0,26 |
0,92±0,25 |
0,87±0,27 |
1,03±0,25 |
1,04±0,22 |
1,09±0,26 |
|
3. |
Decrease in speed during amortization (m/s) |
0,09±0,14 |
0,08±0,12 |
0,09±0,11 |
0,11±0,13 |
0,15±0,16 |
0,23±0,20 |
0,23±0,16 |
|
4. |
Max. speed in the final acceleration (m/s) |
1,52±0,11 |
1,48±0,16 |
1,49±0,12 |
1,50±0,15 |
1,53±0,15 |
1,50±0,16 |
1,58±0,16 |
|
5. |
Time before the max. speed in the final acceleration. (sec) |
0,79±0,10 |
0,85±0,11 |
0,86±0,13 |
0,84±0,07 |
0,82±0,12 |
0,82±0,11 |
0,80±0,11 |
|
6. |
Rel. height at the time of Vmax – HVmaxOtn (%) |
0,39±0,04 |
0,38±0,04 |
0,38±0,03 |
0,37±0,04 |
0,38±0,06 |
0,38±0,04 |
0,38±0,05 |
|
7. |
Max. rel. height – HmaxOtn (%) |
0,50±0,04 |
0,50±0,05 |
0,49±0,02 |
0,48±0,04 |
0,50±0,05 |
0,50±0,04 |
0,50±0,05 |
|
8. |
Rel. height at the time of fixation – HfixOtn (%) |
0,28±0,05 |
0,28±0,07 |
0,28±0,03 |
0,27±0,03 |
0,28±0,04 |
0,29±0,05 |
0,32±0,04 |
|
9. |
Rel. difference (Hmax-Hfix) (%) |
0,22±0,03 |
0,22±0,05 |
0,21±0,02 |
0,21±0,04 |
0,22±0,03 |
0,21±0,04 |
0,19±0,03 |
|
10. |
Maximum power in the final acceleration (W) |
873±281 |
2103±445 |
2186±428 |
2387±550 |
2469±586 |
2625±569 |
3231±503 |
|
11. |
Maximum of the relative power in the final acceleration (W/kg) |
39,4±5,8 |
38,6±6,9 |
38,1±7,5 |
38,3±9,1 |
36,6±8,6 |
35,6±7,4 |
33,8±5,3 |
|
12. |
Time of the squat while pushing the bar up from the chest (s) |
0,34±0,05 |
0,34±0,06 |
0,34±0,06 |
0,34±0,05 |
0,34±0,05 |
0,32±0,07 |
0,33±0,10 |
|
13. |
Relative depth of the squat while pushing the bar up from the chest (%) |
0,12±0,01 |
0,12±0,02 |
0,12±0,01 |
0,12±0,01 |
0,12±0,02 |
0,12±0,01 |
0,11±0,03 |
|
14. |
Maximum speed of the squat (m/s) |
-1,00±0,15 |
-1,00±0,14 |
-1,00±0,12 |
-0,97±0,24 |
-1,08±0,13 |
-0,99±0,24 |
-1,00±0,28 |
|
15. |
Time of pushing the bar up from the chest (s) |
0,45±0,04 |
0,46±0,04 |
0,46±0,04 |
0,47±0,04 |
0,49±0,03 |
0,47±0,04 |
0,47±0,08 |
|
16. |
Maximum speed of pushing up from the chest (m/s) |
1,63±0,13 |
1,58±0,15 |
1,56±0,14 |
1,63±0,13 |
1,64±0,17 |
1,57±0,30 |
1,60±0,40 |
|
17. |
Max. power while pushing (W) |
2213±491 |
2507±559 |
2527±638 |
2873±644 |
2913±645 |
3091±969 |
3620±1440 |
|
18. |
Max. rel. power while pushing (W/kg) |
46,6±10,3 |
46,4±10,6 |
44,0±11,1 |
46,0±9,2 |
43,2±9,1 |
42,0±13,1 |
37,4±13,5 |
Correlations
The analysis of correlations between kinematic and dynamic parameters of the bar movement and the results in the snatch and clean and jerk lifts showed that virtually no statistically significant relationships were observed in the groups of elite weightlifters both men and women between all of the selected indicators and the results of the bar movement in classic exercises. The only parameter determining athletic performance is the maximum power developed by athletes during the acceleration of the bar in the final phase of lifting it and while pushing it up from the chest. The value of the coefficients of correlation between this index and the results in the snatch and the clean and jerk lifts in men and women varied from 0,72 to 0,81 (p <0,001). Note that in women compared to men, the maximum of relative power also statistically significantly correlates (0,41, with p<0,001) with the result of the snatch lift. This indicator is defined as the ratio of the power to the weight of the athlete's body.
Figures 2 and 3 show the correlations and regression equations between the maximum power and the result in the snatch lift for men and women. Since the coefficients considering the arguments in these equations for men and women are almost identical (0.0196 for men and 0.0197 for women), the increase in power by 50 Watts on the average improves the result in the snatch lift at the same value, by approximately 1 kg. Free values in the equations differ by 33.9 kg. This suggests that women with the same maximum power would lift in a snatch on the average 33.9 kg less than men.
Conclusion
Thus, the study of the patterns of changes in kinematic and dynamic parameters of the bar movement with increasing results in the classic exercises in elite athletes (Master of Sports and International Master of Sports), representatives of different weight categories, leads to the following major conclusions.
The average values of the indices of the bar movement, registered in the conditions of competition, can be used as model characteristics of speed-strength and technical skills of elite athletes and as a guidance when training less skilled athletes.
The power being developed by an athlete at fast bar acceleration, power clean and jerk, is the most informative index for estimation of the level of athletes' fitness and forecasting of sports results.
The regression equations between the result in a snatch and maximal power at final acceleration prove that the same power increment (by 50 Watt) on the average increases the result in a snatch by the same amount (approximately 1 kg) among men and women. But men usually lift heavier weights (approximately by 34 kg), on the average compared with women in case of similar power, developed by athletes at final acceleration.
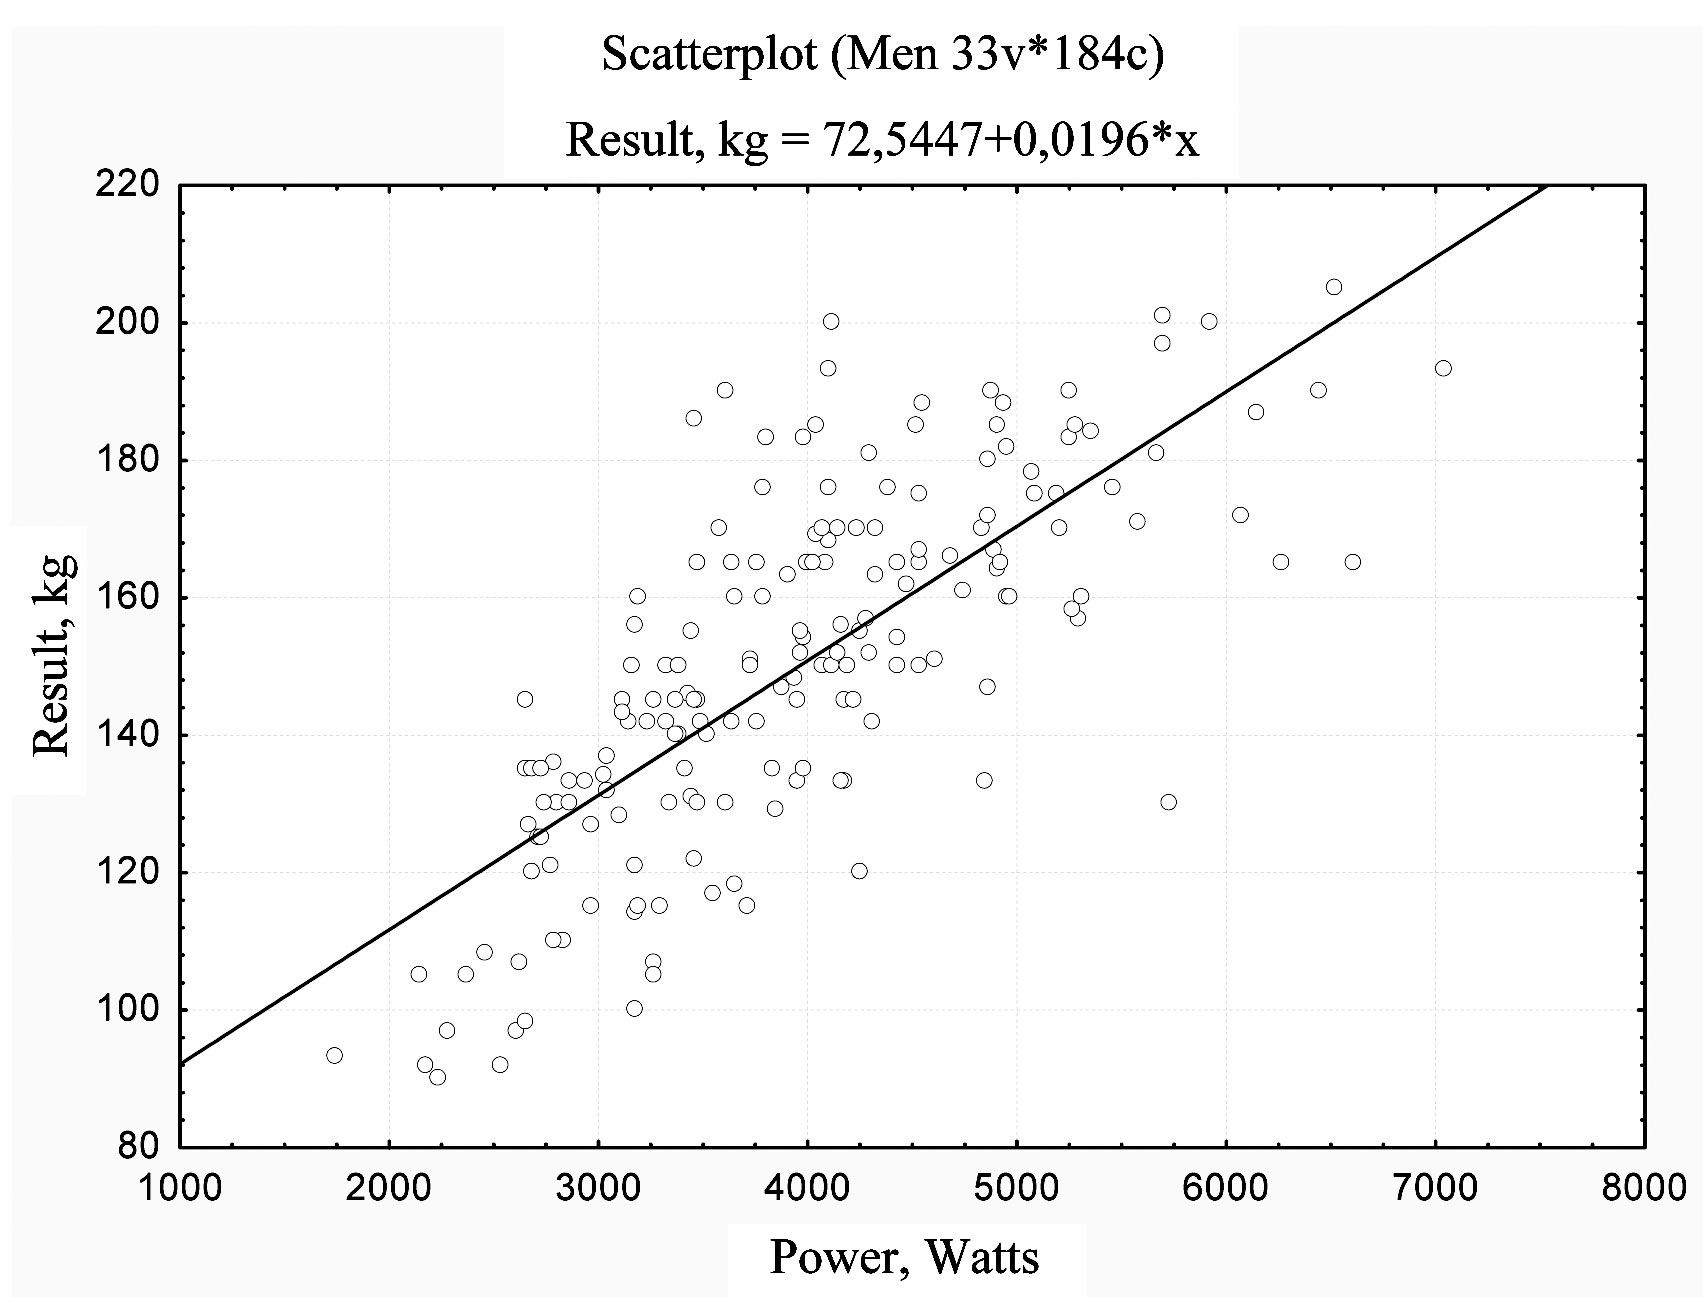
Fig. 2. Correlation (r = 0,75) and the regression equation between the maximum power and the result in the snatch lift in men (n=184)

Fig. 3. Correlation (r=0,81) and the regression equation between the maximum power and the result in the snatch lift in women (n=147)
References
- Shalmanov, A.A. Kinematics and dynamics of weight movement in elite athletes in competitive conditions / A.A. Shalmanov, V.F. Skotnikov, A.V. Panin // Journal "Olimp". – 2012. – № 2-3. – P. 27-31. (In Russian)
- Shalmanov, A.A. Biomechanical monitoring of technical and speed and strength fitness of weightlifters / A.A. Shalmanov, V.F. Skotnikov // Teoriya i praktika fizicheskoy kultury. – 2013. – № 2. – P. 103-106. (In Russian)
- Baumann, W. The snatch technique of world class weightlifters at the 1985 world championships / W. Baumann, V. Gross, K. Quade et al. // International journal of sport biomechanics. – 1988. –N 4. – PP. 68–89.
- Garhammer, J. Biomechanical profiles of Olympic weightlifters / J. Garhammer // International Journal of Sport Biomechanics. – 1985. – N 1. – РР. 122–130.
- Garhammer, J. A comparison of maximal power outputs between elite male and female weightlifters in competition / J. Garhammer // International Journal of Sport Biomechanics. – 1991. – N 7. – РР. 3–11.
- Isaka, T. Kinematic analysis of the barbell during the snatch movement of elite Asian weight lifters / T. Isaka, J. Okada, K. Funato // Journal of Applied Biomechanics. – 1996. – N12. – РР. 508–516.
- Gourgoulis, V. Three-dimensional kinematic analysis of the snatch of elite Greek weightlifters / V. Gourgoulis, N.Aggelousis, G.Mavromatis, A.Garas // Journal of Sports Science. – 2000. – N 18. – PP. 643–652.


 Журнал "THEORY AND PRACTICE