The Effect of Transcutaneous Electrical Stimulation of Spinal Cord on Functionalities of Athletes' Motor System
Фотографии:

ˑ:
R.M. Gorodnichev, professor, Dr.Biol.
E.A. Mikhaylova, Ph.D.
V.Yu. Ershov
Yu.P. Gerasimenko, professor, Dr.Biol.
V.N. Shlyakhtov, associate professor, Ph.D.
Velikie Luki state academy of physical culture and sport, Velikie Luki
Key words: electrical stimulation, spinal cord, motor system.
Introduction. According to modern ideas on the regulation of natural locomotions (walk, running), the activity of neuronal networks of interneurons of spinal cord, located in the cervical and lumbar enlargements is of special importance. They are usually called step movements generators (SMG). All mammals, including humans, have such neuronal networks [3, 6].
The activation of the step movements generator was proved to be caused by various noninvasive methods: leg muscle vibration [3], electromagnetic stimulation of segments of the lumbar part of the spinal cord [1, 2], transcutaneous electrical stimulation of spinal cord [2, 5]. Each of the stipulated methods of motor challenge has its features. Muscle vibrostimulation provokes movements only in hip and knee joints. Technical capabilities of the electromagnetic stimulator contribute to influencing the spinal cord for 15-20 seconds and thus activating SMG for a short period of time. The subjects easily go through the transcutaneous electrical stimulation of the spinal cord, which can ensure initiation of involuntary movements in all joints of lower limbs [2] for a long time. The transcutaneous electrical stimulation is supposed to activate the step generator mainly via the dorsal root afferents of the spinal cord and increase the irritability of neuronal locomotor network [2]. Hence, the researchers tried to use the features of electrical stimulation on the spinal cord described above to change the functionalities of the motor system.
The purpose of the study was to examine the influence of electrical stimulation of the spinal cord, being realized when performing a training load, on the athletes’ speed and strength abilities.
Materials and methods. 12 students from Velikie Luki state academy of physical culture and sport, which were specialized in sprint were involved in the experiment. The students were divided into two groups of 6 persons, control (CG) and experimental (EG) one. The experiments were permitted by the Ethics Committee of Velikie Luki state academy of physical culture and sport. All participants were informed about the experiment conditions, and they signed the participant’s agreement according to the Declaration of Helsinki and Russian and International laws.
The experiment consisted of two 5-day training microcycles. The participants from both of the groups repeatedly run every day; the exercises comprised 5 repetitions of 8-second run at maximum speed on a treadmill (HP Cosmos Saturn) switched on in a passive mode. The running time of 8 seconds was chosen in accordance with the biochemical basics for speed and strength development. Athletes fulfilled next running step only when their heart rate reduced to 100-110 bpm. The heart rate was controlled by the Polar monitors.
The students from the EG during the tests were subject to continuous transcutaneous electrical stimulation of spinal cord (TESSC) at the T11-T12 and Т12-L1 levels by a KULON two-channel stimulator (SUAI, Saint Petersburg). Frequency and intensity of the stimulating pulse were selected for every student individually. Rectangular bi-polar pulses of 0.5 ms were carried at a frequency of 10kHz, in order to avoid painful sensations. The students from the CG were not subject to electrical stimulation.
The test report included background investigation of the highest isometric force of the shin muscles at plantar foot bending, speed and strength abilities of the shin muscles and maximum anaerobic power (MAP). These parameters were repeatedly measured after 5 and 10 days of training. During the running tests the electrical activity (EMG) of the thigh and shin muscles was recorded.
The maximum arbitrary isometric force (FES) of the shin muscles was recorded by a Biodex Medical Systems PRO-3 multi-joint complex (USA, 2006). An athlete sat in a chair, his right lower limb being fixed at 110° and 90º at the knee and the ankle joint respectively; the foot of his left lower limb was firmly positioned at 90º at both those joints. The athletes executed foot bending in the ankle joint. Three attempts with 30-second pauses were made, and the best result was fixed.
The speed and strength abilities of the shin muscles were also estimated using the Biodex complex. The tests were carried out for the isotonic type of muscle contractions, and the force output was 80% of athlete’s individual FES. The students fulfilled as many foot bends as they could over 11 s with swing amplitude of 350. The test duration equaled to the average time needed for the athletes to run a 100-m distance. In such a way the temporal parameters of sport contests were simulated. The following values were estimated: general work (J), number of motions during 11 s (times), and motion amplitude (degrees).
In the beginning of every day (after previous warm-up) and after the tests the athletes fulfilled a test foot bending during 11 s using the Biodex complex.
Maximum anaerobic power was determined by a modified 10-second Wingate test [4]. A MONARK ERGOMEDIC 894E bicycle ergometer (Sweden) was used. A weight of 7.5% of athlete’s weight was fixed to the wheel. The bicycle ergometer was accommodated to the athlete: feet were fixed to the pedals, and the saddle height was regulated. Previous warm-up, riding for 0.5-1.0 min at a convenient frequency of pedal rotating was fulfilled. Then, by a signal, fast increase of rotations and further riding with a maximum speed during 10 s was realized. Peak power, average power during 10 s, minimal power and power drop were recorded.
The results were statistically treated by a single-factor dispersion analysis (ANOVA one way), and by a single-factor dispersion analysis for repeated measurements (One-way Repeated Measures ANOVA).
Results and discussion. The results of the tests on the estimation of maximum number of foot bending are listed in Table 1. The value of general work, as well as the motion numbers and their amplitude in the control group before the tests were somewhat higher than in the experimental one; however, these differences were insignificant (р>0.05).
Table 1. The results of foot bending tests, М± m
|
Parameter |
Group |
Background |
After 5 days |
After 10 days |
|
General work, J |
CG |
1166.8±53.8 |
1271.3±108.4 |
1271.6±95.0 |
|
EG |
1104.4±106.7 |
1323.2±134.7 |
1410.5±168.8* |
|
|
Number of motions, times |
CG |
26.8±0.47 |
30.0±1.29 |
32.8±1.42* |
|
EG |
24.6±0.91 |
28.8±1.75 |
33.4±1.28* |
|
|
Amplitude of motions, degrees |
CG |
27.63±0.98 |
26.90±1.46 |
26.16±1.03 |
|
EG |
26.33±1.49 |
26.35±1.47 |
26.68±1.77 |
*Note: the credibility of differences p<0.05 relative to background.
After 5 days of training the value of general work in the CG increased by 8,95% compared to the background, and after 10 days average general work exceeded the background value by 8,98% (p>0,05). In the EG 5-day training led to an increase in the general work by 19,9% (p>0,05), and 10-day training – by 27,7% (p<0,05). Thus, the members of the EG after 10 days of the tests executed a higher general work.
The number of motions made in 11 s in the CG exceeded the background values during two weeks of tests. After 5 days it grew up by 11,8%, after 10 days – by 22,3% (p<0,05). As in the CG, the number of motions realized in 11 s in the EG exceeded the background values over the whole experiment. After 10 days it increased by 35.4% (p<0,05). Therefore, the increase in the number of motions in the EG was 13,1% higher compared to the CG.
The amplitude of motions of the ankle joint at the foot bending test in the CG after 5 days was 2,7% lower than the background one, and after 10 days it was 5,4% lower (p>0.05).
The amplitude of motions of the EG students after 5 days did not noticeably differ from the background value, and somewhat increased (1,4%, p>0,05) after 10 days. So, the runners from the CG showed a reduction in motion amplitude with the motion number increasing after 10-day training, whereas athletes of the EG fulfilled more motions at rather constant amplitude.
An analysis of the dynamics of general work performed by the athletes daily during the foot bending prior to the peak load revealed a wavy type of changes in the CG (Figure). A considerable rise of the general work relative to the background was revealed only by the 6th day. The changes in the general work of the EG were somewhat different. During the first week of training the general work has increased, with an insignificant reduction on the 5th day. Between the 6th and 10th days the general work values were reliably higher than at the first week of training, and no considerable fluctuations of those values were found during the second test microcycle.
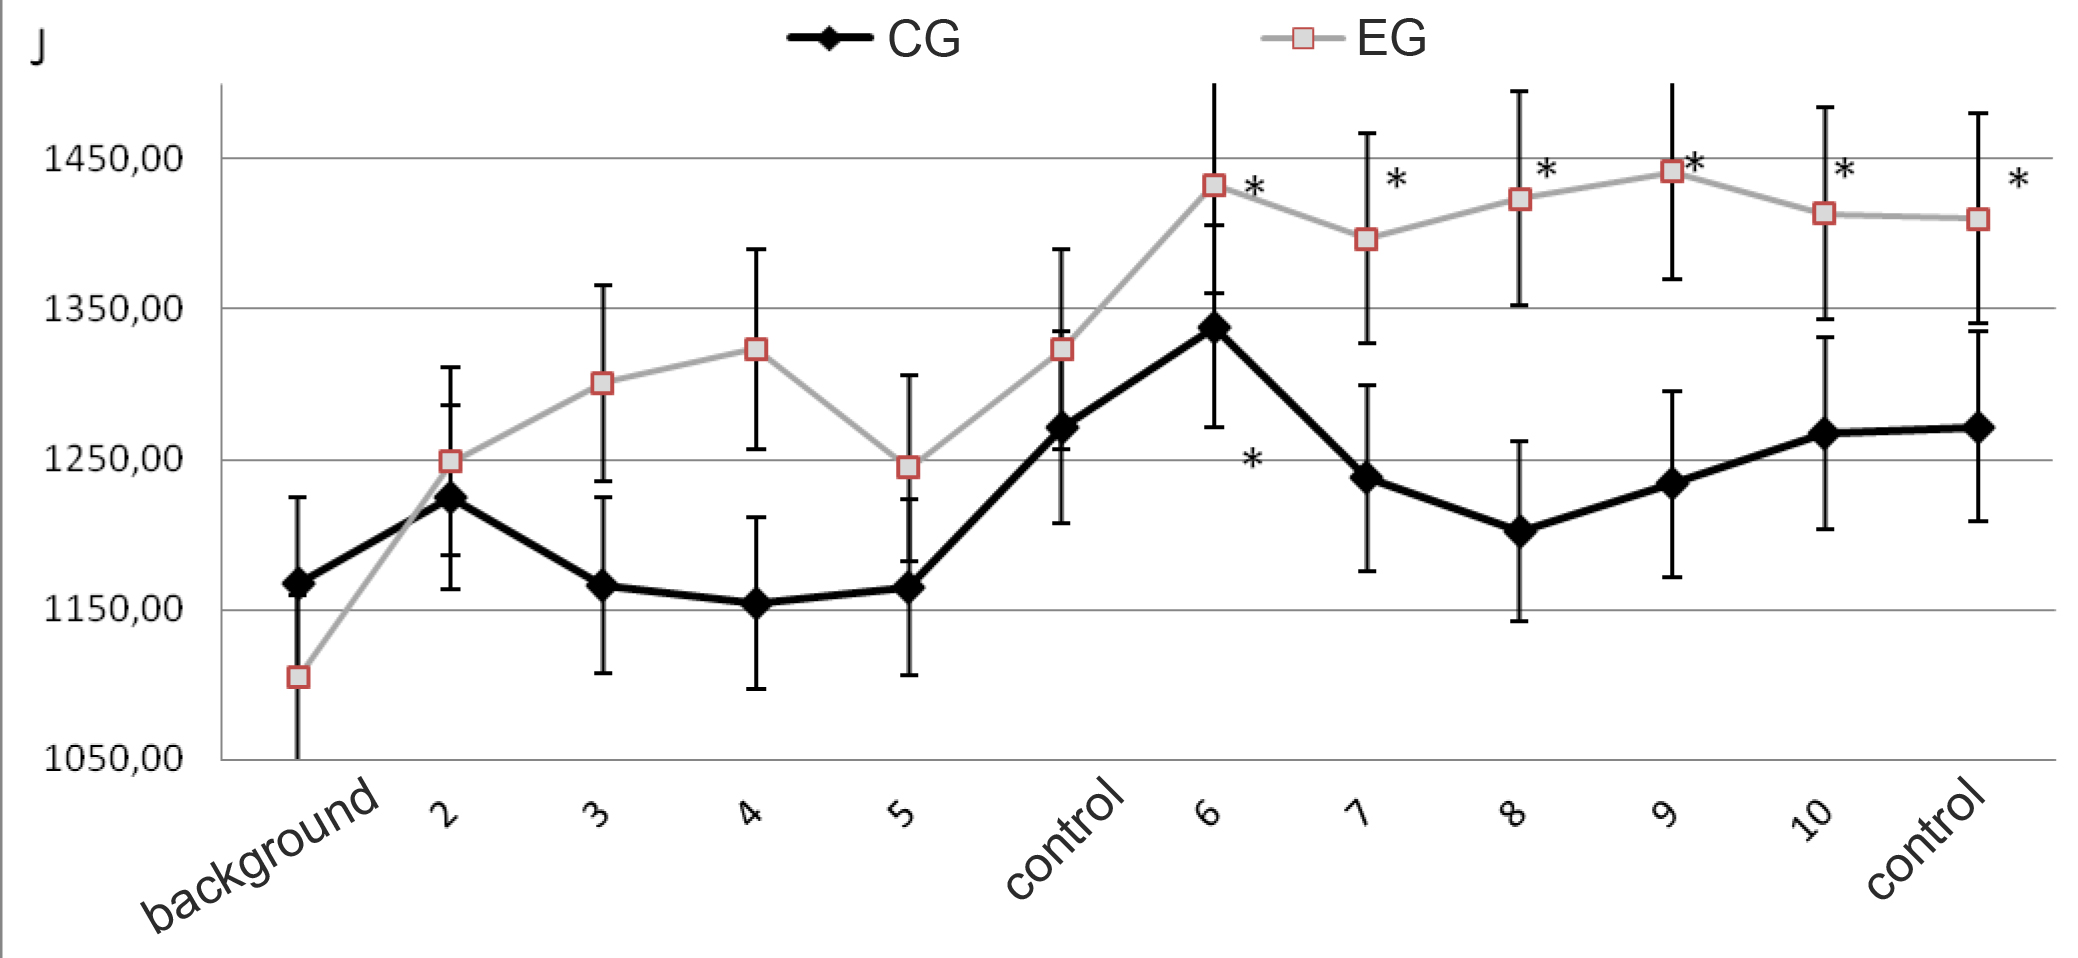
*Note: the credibility of differences p<0.05 relatively to background.
Fig. Dynamics of the general work at foot bending before the training
In the MAP test for the maximum anaerobic power relative parameters were analyzed, taking into account the athletes’ body weights. There were no statistically significant differences in the MAP values between the groups (Table 2).
Table 2. MAP values (W/kg) in the groups, М± m
|
Parameter |
Group |
Background |
After 5 days |
After 10 days |
|
Peak power |
CG |
15.37±0.51 |
15.40±0.52 |
15.48±0.80 |
|
EG |
16.98±0.66 |
17.53±0.45 |
17.74±1.08 |
|
|
Average power |
CG |
9.66±0.37 |
9.70±0.39 |
9.84±0.39 |
|
EG |
10.24±0.32 |
10.25±0.21 |
10.43±0.32 |
|
|
Minimum power |
CG |
5.45±0.48 |
5.08±0.55 |
6.25±0.42* |
|
EG |
4.98±0.69 |
4.99±0.80 |
6.15±0.35* |
|
|
Power drop |
CG |
9.92±0.50 |
10.32±0.49 |
9.22±0.80 |
|
EG |
12.00±0.45 |
12.54±0.69 |
11.61±1.17 |
*Note: the credibility of differences p<0,05 relative to background; # - the credibility of differences p<0,05 between the groups.
The peak power in the control group did not changed noticeably both after the first and the second week of training. After the first 5 days of training its value grew by 0,1% and after 10 days – by 0,7% (р>0,05). 10-second average power also changed insignificantly: after 5 days it increased by 0,4%, and after 10 days – 1.8% (р>0.05). The lowest power after the 5th day of training reduced by 6,3% (р>0,05), and after the 10th day it reliably increased by 14,6% (p<0,05) as compared to the background level. The index of power decrease in 10 s did not change significantly.
The peak power of the EG after 5 days increased by 3,2%, and after 10 days by 4,4% (р>0,05). Average 10-second power varied insignificantly, increased by 1,8% (р>0,05). The minimum power after the 5 days actually did not change (0,2% increment at р>0,05), whereas after 10 days it increased by 23,4% (p<0,05) above the background value. Hence, in the EG the minimal power after 10 days increased (by 8,8%) as compared to the CG.
Considering the effect of the TESSC on the functional abilities of the motor system, the increase in the EMG amplitude of the thigh and shin muscles in running tests under the electrical stimulation is to be noted. For example, the amplitude of the right sural muscle at usual running was 203 mV, while at the running with the transcutaneous electrical stimulation it equalled 280 mV. It can be considered as an evidence of the increase of neuronal activity of the motor neuron mode of this muscle under the TESSC. Therefore, the stimulation of spinal cord results in activating additional motor neurons at every training. Perhaps, the trail processes of multiple activations of additional motor neurons provide a significant increase in the speed and strength of skeletal muscles of the EG participants.
Conclusion. The pieces of evidence indicate the potential of development of speed and strength qualities of athletes using the technology of electrical stimulation spinal cord, being implemented when performing voluntary movements.
References
- Gorodnichev, R.M. The new method of activation of human step generators / R.M. Gorodnichev et al. // Fiziologiya cheloveka. – 2010. – № 6. – P. 95–103. (In Russian)
- Gorodnichev, R.M. Transcutaneous electrical stimulation of spinal cord: noninvasive method of activation of human step generators / R.M. Gorodnichev et al. // Fiziologiya cheloveka. – 2012. – № 2. – P. 46–56. (In Russian)
- Gurfinkel, V.S. Are there human step generators? / V.S. Gurfinkel, Yu.S. Levik, O.V. Kazennikov, V.A. Selionov // Fiziologiya cheloveka. – 1998. – № 3. – P. 42. (In Russian)
- Physiological test of elite athlete / Ed. by Dunkan J. MacDougall, Howard A. Wenger, Howard J. Green. – Kiev: Olimpiyskaya literatura, 1998. – 432 P. (In Russian)
- Dimitrijevic M.R. Evidence for a spinal central pattern generator in humans / Dimitrijevic M.R. Y. Gerasimenko , M.M. Pinter// Ann N Y Acad Sci. 1998 V.860 P. 360–76.
- Gerasimenko Y. Epidural stimulation: comparison of the spinal circuits that generate and control locomotion in rats, cats and humans/ Y. Gerasimenko, R.R. Roy, V.R. Edgerton// Exp Neurol. 2008 V.209. Р. 417-25.
Author’s contacts: gorodnichev@vlgafc.ru


 Журнал "THEORY AND PRACTICE