Classic weightlifting clean-and-jerk style: ground response and bar control biomechanics analysis
ˑ:
Dr. Hab., Professor A.A. Shalmanov1
PhD, Professor V.F. Skotnikov1
1Russian State University of Physical Education, Sport, Youth and Tourism (SCOLIPE), Moscow
Keywords: weightlifting technique, exercise phasing, bilateral video captures, dynamometry, clean-and-jerk biomechanics, ground response, mass center, pressure center, horizontal force.
Background. Bar weight, inertial forces in the lifting sequence and ground response may be defined the key external forces controlled by weightlifters. Knowledge of the relevant movement biomechanics with variations depending on the weight class, gender, age and some other factors is critical for the progress and training process efficiency management purposes. Training system improvement efforts should give a high priority to the progress tests with biomechanics analyses in the training and competitive processes that need to generate informative and dependable technical and physical fitness test rates [2].
Objective of the study was to profile and analyze the ground response and bar control biomechanics for classical clean-and-jerk style in weightlifting sport.
Methods and structure of the study. We used for the purposes of the study the Russian State University of Physical Education, Sport, Youth and Tourism-2012 biomechanics test system to rate the technical and speed-strength fitness of the sample [1, 3]. The test technology applies two Canon SLR cameras (Japan-made) rated at 50 snapshots per second; and Ristler dynamometer platform (Switzerland-made) with L-Card 1000 Hz analog-to-digital converter unit and a synchronization system. The bilateral video capturing technology registers the bar butt movement trajectory to obtain the bar mass center movement kinematics and dynamics plus its rotation versus the vertical and sagittal axes. The dynamometric test platform registers the ground response vectors to calculate the pressure center coordinates and profile the athlete-plus-weight system joint mass center travel kinematics and dynamics. Operations of both test technologies were harmonized by a synchronization system with a special software toolkit.
We sampled for the tests junior weightlifters (n=12) from Olympic Reserve School #2 in Moscow qualified Class I to MS, with the sample being 17.2±1.9 years old, 69.9±16.1 kg heavy and 1.68±0.1 m tall on average. The athletes executed clean-and-jerk exercise in the tests with the weighs rated at 85–95% of the individual maximums i.e. 102.2±23.1 kg on average. The ground responses and bar control biomechanics were profiled and analyzed with the movement sequence classified into periods and phases as described in our prior study [5].
Results and discussion. As demonstrated by the clean-and-jerk movement phasing analysis, the prior pull (acceleration) and full-contact sub-squat phase is the longest and the transition (flipping) phase is the shortest in the whole sequence. It should be noted that the best competitors were tested with a longer transition phase (r=0.65) and a shorter full-contact sub-squat phase (r=-0.95). In addition, we found a negative correlation of the aerial dip-and-split (dive) and final acceleration (drive) phases with the competitive success rate.
As demonstrated by the video-captured bar mass center travel profiles and the athlete-plus-weight system joint mass center pressure center profiles produced by the dynamometer platform, the absolute and relative vertical force vectors exceed the forces on the bar in every phase of the movement sequence. As for the horizontal force, the maximal force on the bar at the start of the final acceleration (drive) phase is almost six times higher than the horizontal force of the ground response. This force is applied to drive the bar mass center along a curved line. It should be noted that the maximum of the relative horizontal force on the bar negatively correlates with the clean-and-jerk competitive success rate (r = -0.88).
In the final acceleration phase in the clean sequence, the maximal vertical forces on the bar and ground response were found to positively correlate with the clean-and-jerk competitive success rate. The same applies to the jerk phase.
Analysis of the forces applied by the athletes to drive the bar and pressure rates of the whole system showed the absolute vertical forces being statistically meaningfully correlated with the competitive success rate, and this is particularly true for the dive and drive phases on the jerk, with the only exception for the average acceleration rate for the whole system.
On most of the test scales, the power applied by the athlete to accelerate the system is higher than the bar acceleration power, particularly in the jerk phase. The force to pull the bar on the chest is virtually the same as the whole system acceleration force. It should be mentioned that the applied forces are highly individual, with the variation rang of 13.6% to 42.3%.
The revealed regularities of bar travel dynamics largely coincide with findings of our prior tests timed to competitions [4]. The dynamometric platform made it possible to obtain a wide range of the technical and physical fitness test rates to complement the current biomechanical test service. Of special interest in this context were the pressure center travel data for the clean and jerk phases, all the more that we could not find experimental data in the available study reports on the issue.
In the clean (bar pull on chest) phase, the pressure center travel trajectory was found virtually the same for every athlete. Given on Figure 1 hereunder is the typical pressure center travel trajectory; and Table 1 gives the pressure center profiling data classified for three clean and two jerk phases, with the positive and negative values indicative of mass center movement towards the toes and heels, respectively.
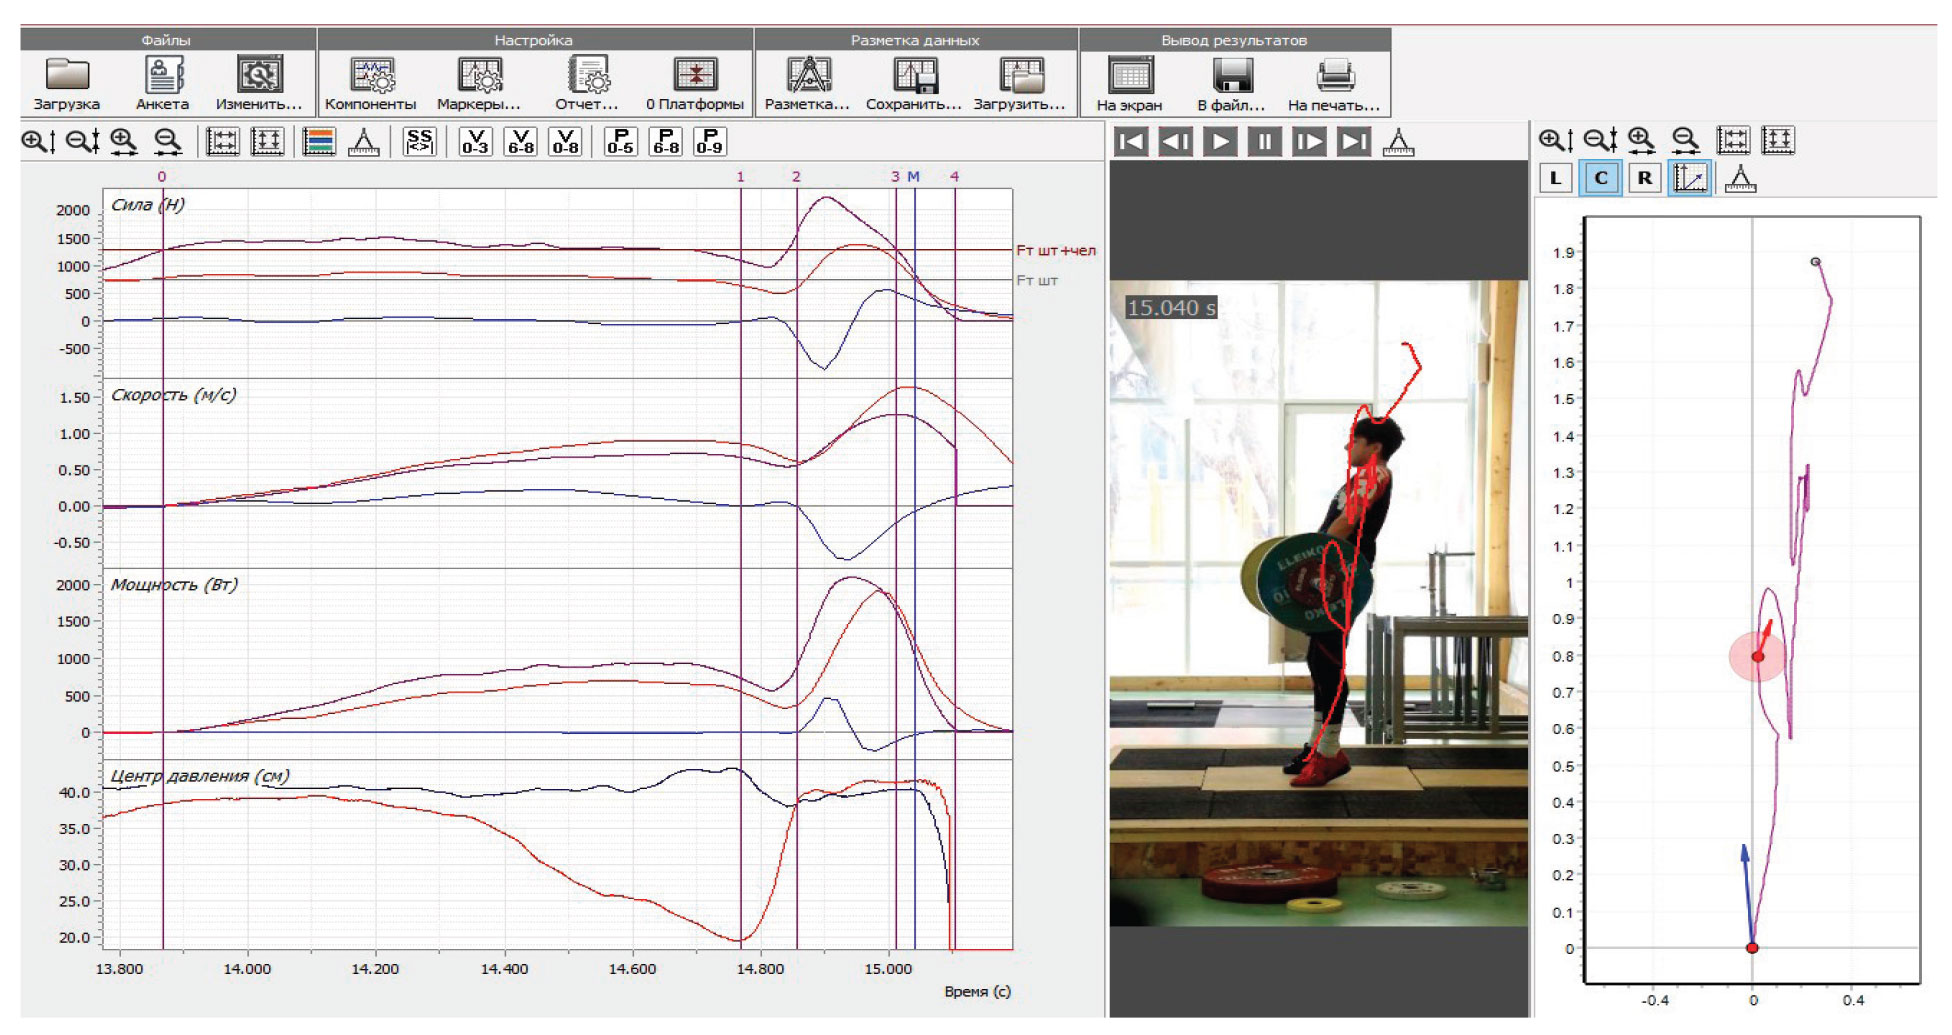
Figure 1. Clean (pull on the chest) kinematics and dynamics profiling test data
Given on the left side of Figure 1 are the force, speed, power and pressure center movement coordinates; vertical lines mark the pull phases; athlete’s movement prior to the jerk phase is given in the middle; and the bar mass center travel trajectory on the right.
At the start of the preliminary acceleration phase, the pressure center moves towards the toes by 2.6±1.5 cm on average. Then the direction is reversed with the pressure center shifted towards the heels by 14.3±6.8 cm (segment 0-1 on the Figure). The body mass center shifts to the heels, and the bar mass center moves toward the body. The pressure center movement at the end of the preliminary acceleration phase is point-centered (r=0.59).
In the transition phase (interval 1-2), the pressure center moves towards the toes by 13.8±5.6 cm, with the body mass center moved to the toes, with the bar mass center still moving towards the athlete's body. In the final acceleration phase (interval 2-M), the pressure center continues moving towards the toes by 5.3±5.2 cm on average, and the bar mass center moves from the athlete's body. It should be noted that the individual phase-specific test rates vary in a wide range.
Table 1. Pressure center travel trajectory in the clean-and-jerk sequence and its correlation with the competitive success rate
|
Test phases |
Mean arithmetic |
Mean square deviation |
Variation ratio |
Correlation ratio |
|
Clean (bar pull to the chest) |
||||
|
Start of the prior acceleration phase, cm |
2,6 |
1,5 |
57,7 |
- |
|
End of the prior acceleration phase, cm |
-14,3 |
6,8 |
47,6 |
0,59 |
|
Transition phase, cm |
13,8 |
5,6 |
40,6 |
- |
|
Final acceleration phase, cm |
5,3 |
5,2 |
98,1 |
- |
|
Jerk (dive and drive off the chest) |
||||
|
Dive, cm |
8,9 |
3,0 |
33.7 |
- |
|
Drive, cm |
2,5 |
2,1 |
84.0 |
-0,57 |
In the jerk (dive and drive) phase, the pressure center moves towards the toes, with the largest shift of 8.9 ± 3.0 cm in the dive and slow-down phases. In the drive phase, the pressure center amplitude is much lower and negatively correlates with the clean-and-jerk competitive success rate (r = -0.59). That means that the higher skilled and successful athletes are less likely to shift to the toes in the jerk phase.
Conclusion. The study analyzes the key phases of the clean-and-jerk sequence versus the competitive success rates in the new clean-and-jerk style phasing system. The analyses made it possible to find additional informative dynamic characteristics to rate the individual technical and speed-strength fitness based on the ground response force rating tests. Absolute and relative vertical ground response force vectors were found to significantly exceed the forces applied to the bar in every movement phase. Thus the maximal horizontal bar force vector at the start of the final acceleration phase was tested almost six times higher than the ground response force gradient. Most of the system acceleration power rates were tested higher than the bar acceleration power, especially in the jerk phases. In the clean (pull on the chest) phase, the bar acceleration power is approximately the same as the whole system acceleration one. The pressure center travel trajectory pattern was virtually the same in the sample, with relatively wide individual variations in the phase-specific shifts of the pressure center. The pressure center shifts were tested the largest in the preliminary acceleration and transition phases.
References
- Zakharov A.A., Shalmanov A.A., Lukunina E.A. Institutional, practical, research and educational components of biomechanical tests in sports. Fizkultura i sport: vospitanie, obrazovanie, trenirovka. 2018. no. 5. pp. 26-29.
- Shalmanov A.A., Skotnikov V., Lanka Ya. Operational and current biomechanical control in sports (problems and solutions). Nauka v olimpiyskom sporte. 2013. no. 4. pp. 40-45.
- Shalmanov A.A., Skotnikov V.F. Biomechanical monitoring of technical and speed -power readiness of weightlifters. Teoriya i praktika fiz. kultury, 2013, no. 2, pp. 103-106.
- Skotnikov V.F., Shalmanov A.A., Panin A.V. Weight Movement in Elite Weightlifters in Competitive Conditions. Teoriya i praktika fiz. kultury. 2014. no. 2. pp. 94-98.
- Shalmanov A.A., Lukunina E.A. Phase Structure and Temporal Indicators of Bar Movement in Clean and Jerk in Weightlifting. Teoriya i praktika fiz. kultury. 2020. no. 1. pp. 79-81.
Corresponding author: shalmanov_bio@bk.ru
Abstract
Objective of the study was to profile and analyze the ground response and bar control biomechanics for classical clean-and-jerk style in weightlifting sport.
Methods and structure of the study. We used for the purposes of the study the Russian State University of Physical Education, Sport, Youth and Tourism-2012 biomechanics test system to rate the technical and speed-strength fitness of the sample. The bilateral video capturing technology registers the bar butt movement trajectory to obtain the bar mass center movement kinematics and dynamics plus its rotation versus the vertical and sagittal axes. The dynamometric test platform registers the ground response vectors to calculate the pressure center coordinates and profile the athlete-plus-weight system joint mass center travel kinematics and dynamics. We sampled for the tests junior weightlifters (n=12) from Olympic Reserve School #2 in Moscow qualified Class I to MS, with the sample being 17.2±1.9 years old, 69.9±16.1 kg heavy and 1.68±0.1 m tall on average. The athletes executed clean-and-jerk exercise in the tests with the weighs rated at 85–95% of the individual maximums i.e. 102.2±23.1 kg on average.
Results and conclusions. The study analyzes the key phases of the clean-and-jerk sequence versus the competitive success rates in the new clean-and-jerk style phasing system. The analyses made it possible to find additional informative dynamic characteristics to rate the individual technical and speed-strength fitness based on the ground response force rating tests. Absolute and relative vertical ground response force vectors were found to significantly exceed the forces applied to the bar in every movement phase. Thus the maximal horizontal bar force vector at the start of the final acceleration phase was tested almost six times higher than the ground response force gradient. Most of the system acceleration power rates were tested higher than the bar acceleration power, especially in the jerk phases. In the clean (pull on the chest) phase, the bar acceleration power is approximately the same as the whole system acceleration one. The pressure center travel trajectory pattern was virtually the same in the sample, with relatively wide individual variations in the phase-specific shifts of the pressure center. The pressure center shifts were tested the largest in the preliminary acceleration and transition phases.


 Журнал "THEORY AND PRACTICE