Russia’s regional disharmonies in team sport development process: pareto diagram data analysis
ˑ:
PhD, Associate Professor A.I. Petrov1
D.A. Petrova2
1Tyumen Industrial University, Tyumen
2Ural Federal University named after the first President of Russia B.N. Yeltsin, Yekaterinburg
Keywords: team sports, progress analysis, point scores, Pareto Diagram, regional contributions to the national total
Background. In February 2018 the Petersburg Politics Foundation came up with its tenth ranking of the Russian regions by the team sports progress statistics [3, 1]. It has been traditional since July 2013 to report on a yearly basis the regional standings on the national team sport scoreboard for such sports as women’s/ men’s football, ice hockey, bandy, basketball, volleyball, handball, mini football, rugby, water polo and field hockey. Having the regional progress statistics for a few years, the sport community may keep track of the regional and national progresses and regresses in different team sport disciplines. However, the simple ranking of the regions provide too limited data for many analyses including the attempts to rate disharmonies/ disproportions in the interregional team sport progresses across the country. This gap may be bridged by a Pareto Diagram that makes it possible to effectively rate a contribution of every region in the national progress of the team sports. We used the yearly databases to make a year-to-year (2015 to 2014, and 2018 to 2017, as of January 1) analysis of the national team sports progress disharmonies across the regions [4].
Objective of the study was to rate interregional disharmonies in the national team sports progress statistics.
Method of the study. The Pareto Diagram [5] was used to rate inconsistencies in the subject database [2] in a few stages. At stage one, we analyzed the database to compute the total team sports progress score for the whole country: thus it equaled 1,012,698 points in 2017. At stage two, a contribution of every region to the total score was computed: e.g. the Moscow clubs contribution to the 2017 national team sports total was estimated at 114,951/1,012,698) = 0.114 (11.4%); and the Tatarstan Republic contribution totaled 64,974/1,012,698) = 0.064 (6.4%). Now having such regional progress subtotals, we may calculate the regional sport clubs’ contributions to the national total and visualize it by a cumulative curve known as the Lawrence curve [2] indicative of the regional irregularities in the specific team sport progresses across the country. We used this method to visualize the reporting data of 2017 and 2014: see Tables 1 and 2, respectively.
Results and discussion. Given in Table 1 is the regional team sports progress data with the national total of 2017. These data were used to make the Pareto Diagram to identify the regional contributions to the national total: see Figure 1. The same was done for the 2014 data (Table 2).
Table 1. Regional team sports progress data with the national total of 2017 (as of Jan 01, 2018) used as an input for the Pareto Diagram
|
Russian region |
Regional subtotal, points |
Contribution |
Ranking |
Cumulative value |
|
Moscow |
114 951 |
0,1135 |
1 |
0,114 |
|
Tatarstan Republic |
64 974 |
0,0642 |
2 |
0,178 |
|
Saint Petersburg |
57 981 |
0,0573 |
3 |
0,235 |
|
Krasnodar Area |
49 209 |
0,0486 |
4 |
0,284 |
|
Sverdlovsk Oblast |
39 606,5 |
0,0391 |
5 |
0,323 |
|
Krasnoyarsk Area |
36 182 |
0,0357 |
6 |
0,358 |
|
Moscow Oblast |
31 713,5 |
0,0313 |
7 |
0,390 |
|
Khabarovsk Area |
29 400 |
0,0290 |
8 |
0,419 |
|
Samara Oblast |
27 897 |
0,0275 |
9 |
0,446 |
|
Novosibirsk Oblast |
23 565 |
0,0233 |
10 |
0,470 |
|
Chelyabinsk Oblast |
22 738 |
0,0225 |
11 |
0,492 |
|
Bashkortostan Republic |
22 347,5 |
0,0221 |
12 |
0,514 |
|
Tyumen Oblast |
11 940 |
0,0118 |
26 |
0,745 |
|
Udmurt Republic |
11 830 |
0,0117 |
27 |
0,757 |
|
Nenetsk Autonomous Area |
0 |
0 |
82 |
1,000 |
|
Chukotsk Autonomous Area |
0 |
0 |
83 |
1,000 |
|
National total (83 regions) |
1 012 698 |
- |
- |
- |
|
Note: There are formally 85 regions in Russia, but the Table gives only 83 of them since the Crimean Republic and Sevastopol city (1) joined Russia only on 26.03.2014; and (2) their regional sport clubs are still barred from the national competitions by the relevant international sport federations |
||||
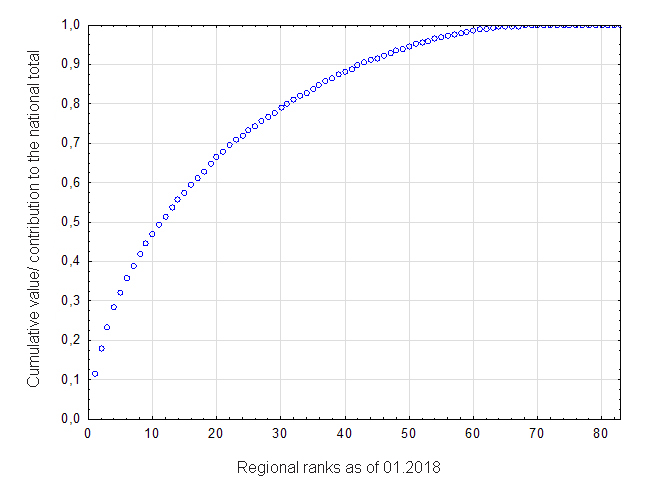
Figure 1. Pareto Diagram showing irregularities in the regional team sport progresses in 2017
Table 2. Regional team sports progress data with the national total of 2014 (as of Jan 01, 2015) used as an input for the Pareto Diagram
|
Russian region |
Regional subtotal, points |
Contribution |
Ranking |
Cumulative value |
|
Moscow |
102 984 |
0,0949 |
1 |
0,095 |
|
Tatarstan Republic |
63 037,5 |
0,0581 |
2 |
0,153 |
|
Krasnodar Area |
58 617 |
0,0540 |
3 |
0,207 |
|
Moscow Oblast |
49 104 |
0,0453 |
4 |
0,252 |
|
Saint Petersburg |
44 804,5 |
0,0413 |
5 |
0,294 |
|
Krasnoyarsk Area |
32 655 |
0,0301 |
6 |
0,324 |
|
Nizhny Novgorod Oblast |
29 812,5 |
0,0275 |
7 |
0,351 |
|
Novosibirsk Oblast |
28 582,5 |
0,0263 |
8 |
0,378 |
|
Sverdlovsk Oblast |
28 043,6 |
0,0259 |
9 |
0,403 |
|
Samara Oblast |
27 352,5 |
0,0252 |
10 |
0,429 |
|
Mordovia Republic |
26 100 |
0,0241 |
11 |
0,453 |
|
Chelyabinsk Oblast |
25 044 |
0,0231 |
12 |
0,476 |
|
Khabarovsk Area |
24 190 |
0,0223 |
13 |
0,498 |
|
Tyumen Oblast |
11734 |
0,0118 |
36 |
0,818 |
|
Udmurt Republic |
11602,5 |
0,0101 |
37 |
0,828 |
|
Nenetsk Autonomous Area |
0 |
0 |
82 |
1,000 |
|
Chukotsk Autonomous Area |
0 |
0 |
83 |
1,000 |
|
National total (83 regions) |
1084752 |
- |
- |
- |
|
Note: There are formally 85 regions in Russia, but the Table gives only 83 of them since the Crimean Republic and Sevastopol city (1) joined Russia only on 26.03.2014; and (2) their regional sport clubs are still barred from the national competitions by the relevant international sport federations |
||||
Given on Figure 2 are the Pareto Diagrams [1, 2] showing the interregional team sport progress irregularities of 2014 versus 2017.
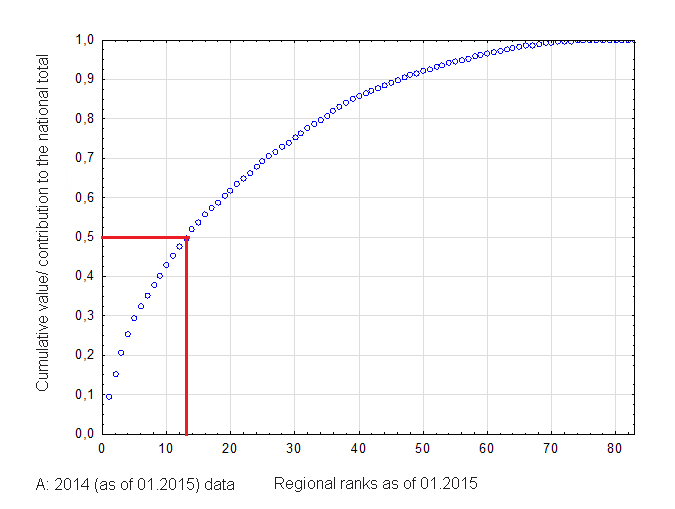
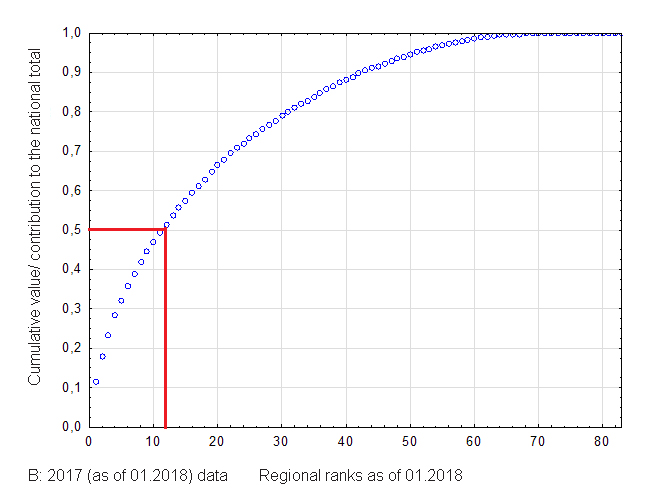
Figure 2. Pareto Diagrams showing the interregional team sport progress irregularities of 2014 versus 2017
The diagrams visualize the fact that only 12 regions in 2017 and 13 regions in 2014 accounted for 50% to the cumulative value, with the other 70-71 regions contributing the other 50%. This picture shows great distortions in the team sport progress across the country, with 42 underdeveloped regions out of 83 investing less than 10% to the national total. We singled out the leading regions that account for 50% of the cumulative value to track variations in the process (see Table 3) for the analysis hereunder.
Table 3. Variations (2017 to 2014) in the team sports progress in the leading Russian regions
|
Leading regions |
2014 input |
2014 ranking |
2017 input |
2017 ranking |
Change, % |
|
|
Moscow |
0,0949 |
1 |
0,1135 |
1 |
+ 19,6 |
|
|
Tatarstan Republic |
0,0581 |
2 |
0,0642 |
2 |
+ 10,5 |
|
|
Krasnodar Area |
0,0540 |
3 |
0,0486 |
4 |
- 10,0 |
|
|
Moscow Oblast |
0,0453 |
4 |
0,0313 |
7 |
- 30,9 |
|
|
Saint Petersburg |
0,0413 |
5 |
0,0573 |
3 |
+ 38,7 |
|
|
Krasnoyarsk Area |
0,0301 |
6 |
0,0357 |
6 |
+ 18,6 |
|
|
Nizhny Novgorod Oblast |
0,0275 |
7 |
No leader in 2017 |
- 24,8 |
||
|
Novosibirsk Oblast |
0,0263 |
8 |
0,0233 |
10 |
- 11,4 |
|
|
Sverdlovsk Oblast |
0,0259 |
9 |
0,0391 |
5 |
+ 50,9 |
|
|
Samara Oblast |
0,0252 |
10 |
0,0275 |
9 |
+ 9,1 |
|
|
Mordovia Republic |
0,0241 |
11 |
No leader in 2017 |
- 74,7 |
||
|
Chelyabinsk Oblast |
0,0231 |
12 |
0,0225 |
11 |
- 2,6 |
|
|
Khabarovsk Area |
0,0223 |
13 |
0,0290 |
8 |
+ 30,0 |
|
|
Bashkortostan Republic |
No leader in 2015 |
0,0221 |
12 |
0 |
||
Conclusion. Based on the study data and analyses, we found the following:
- Pareto Diagram with analysis makes it possible to effectively visualize the interregional irregularities in the team sport progress reporting data.
- Only 12 regions in 2017 and 13 regions in 2014 accounted for 50% of the cumulative value, with the other 70-71 regions found to contribute the other 50%. This may be indicative of the resources and sporting gifts naturally migrating to the most sporting regions, as demonstrated, e.g. by the Tyumen Oblast standing on the regional scoreboard (36 place in 2014 and 26 place in 2017) with its contribution to the national cumulative value standing unvaried at 0.0118 (1.18%).
- No serious changes has been found in the team sports progress statistics for the three years in the leading group, with the group of 13 regional leaders in 2014 reduced to 11 in 2017.
- Republic of Mordovia and Nizhny Novgorod Oblast left the leading group in 2017 as their contributions to the national cumulative value sagged by 75% and 25%, respectively.
- Moscow city remains the undisputed leader on the team sports progress scale, with its contribution to the national cumulative value reported to grow by 20% for the three years (from 9.49% to 11.35%); followed by Tatarstan Republic with the tree-year growth by 11%.
- Bashkortostan Republic joined the leading group to move from 14 to 12 place, whilst its contribution to the national total stayed unvaried for the period.
- Some regional progresses were very significant: thus the Sverdlovsk Oblast stepped up its contribution by +51% and moved up from the 9th to 5th place on the scoreboard. Saint Petersburg mage progress of +38.7% and moved from the 5 to 3 place; and the Khabarovsk Area contribution grew by +30% with its place changing from the 13 to 8.
-
Some regions have failed to keep their positions in the leading group. Thus the Moscow Oblast contribution to the cumulative value dropped by 31% and it stepped down from the 4 to 7 place. Novosibirsk Oblast and Krasnodar Area also reported 10-11% drops in their contributions and lost 1-2 points in their rankings.
- The lagging behind 42 underdeveloped regions out of 83 were found to invest less than 10% to the national total. The most successful (top 20) and most unsuccessful (ranked 64-83) regions were estimated to differ 130 time in the points scored (0.647/0.005 = 130), with this finding indicative of the extreme irregularities in the team sports progress across the country.
-
It may be assumed that the migration of the team sports resources and sporting gifts to the leading regions is natural in the present situation – since the same trends are reported worldwide.
-
Some regional progresses were found clearly facilitated by the local governmental policies as demonstrated by some leading regions. Thus N.I. Merkushkin, Mordovia Republic Governor had made much for the Republican progress in the team sports reported at 2.41% of the national total in 2014. Upon his retirement the Republican contribution sagged to as little as 0.61% in 2017 and the Republic dropped out of the leading group with its ranking falling by 30 points to the 46 place as of 01.01.2018. The Nizhny Novgorod Oblast reported the same regress for the same reason: when the teams-sports-sensitive [Governor] V.P. Shantsev retired in late 2017, the Oblast immediately lost its ranking on the team sports progress scoreboard.
References
- Desyaty reyting komandnykh igrovykh vidov sporta v Rossiyskoy Federatsii [10th ranking in team game sports in the Russian Federation]. [Electronic resource] Available at: https://fpp.spb.ru/fpp-sport4 (date of access 11.02.2018).
- Lavrovskiy B.L., Shiltsin E.A. Rossiyskie regiony: sblizhenie ili rassloenie? [Russian regions: rapprochement or stratification?]. Ekonomika i matematicheskie metody, 2009. v. 45. no. 2. pp. 31-36.
- Moskva bet rekordy. Peterburg obkhodit Krasnodar [Moscow breaks records. Saint Petersburg beats Krasnodar]. [Electronic resource] Available at: http://www.sport-express.ru/ chronicle/reviews/moskva-bet-rekordy-peterburg-obhodit-krasnodar-1366491/ (date of access: 11.02.2018)
- Chetverty reyting komandnykh igrovykh vidov sporta v Rossiyskoy Federatsii [4th ranking in team sports in the Russian Federation]. [Electronic resource] Available at: https://fpp.spb.ru/fpp-sport4. (date of access 11.02.2018).
- Pareto V. Cours d’Économie Politique: Nouvelle édition par G.-H. Bousquet et G. Busino. Librairie Droz.: Geneva, 1964. pp. 299-345.
Corresponding author: ArtIgPetrov@yandex.ru
Abstract
Objective of the study was to analyze regional irregularities in the team sport progress using Pareto Diagram to quantify and profile the regional contributions to the national competitive successes. The study was designed to rate and compare the regional contributions to the national total; plus analyze the competitive progress on a year-to-year basis (2015 to 2014, and 2018 to 2017, as of January 1). The Pareto Diagram was formed in a few stages: regional team sports progress in points was rated at stage 1; and the regional contributions to the national total competitive success were weighted at stage 2. Having the team sport progress scores for every Russian region, we could compute the elementary regional sport clubs’ contributions to the national total. These data were analyzed to produce the summarized curve to visualize and quantify the regional disharmonies/ irregularities in the team sports progress domain.


 Журнал "THEORY AND PRACTICE