Heart rate variability data visualizing method for elite sports
ˑ:
Dr.Biol., Professor Y.A. Shchedrina1
Associate Professor, PhD V.F. Lutkov1
Associate Professor, PhD N.V. Lutkova1
Dr.Hab., Professor Y.M. Makarov1
Master's student M.M. Tsepelevich2
1Lesgaft National State University of Physical Education, Sport and Health, St. Petersburg
2St. Petersburg State University, St. Petersburg
Keywords: heart rate variability data, Pythagoras tree, skilled athletes.
Introduction. In medical and sports practice, the heart rate variability (HRV) analysis is one of the most common methods for assessing the functional state of the human body [1, 2, 5]. The most general HRV data visualizing methods are summary tables and charts showing individual HRV rates, as well as integral estimation of the functional state indicated by one of the traffic light colors [1-5]. The data obtained by the first method cannot be visualized, but can give a quantitative estimation of the subject’s functional state, focusing on the typical HRV mean values, as well as provide an idea of the role of each mechanism of heart rate regulation. The second data visualizing method is uninformative as the summary estimate of the subject’s physical condition on the three-color scale does not enable to identify the degree of involvement of each mechanism of heart rate regulation. This necessitates the need to search for such a HRV data visualizing method, which would enable not only to assess the subject’s physical state but also to determine the contribution of each mechanism, which is necessary primarily for the correction of the training and rehabilitation processes.
Objective of the study was to develop a HRV data visualizing method and create a software application that would enable to design the "Pythagoras trees" based on the analysis of the obtained data.
Methods and structure of the study. The study involved 20 skilled athletes (from the I sports category to the Master of Sports in swimming). HRV was recorded for 5 minutes on land and 5 minutes in water using Polar V-800 heart rate monitor. The data obtained were calculated using the Kubios HRV Standard software. The survey in water was carried out in the initial position: the subject lay on the chest and breathed through a snorkel. Two Pythagoras trees were designed for each athlete: for in-water and on-land rates.
Results and discussion. The algorithmic design of the Pythagoras tree is based on a proportional increase/ decrease in the following parameters: height, inclination, color and branches (i.e. their quantity and density) indicative of the relevant test rates: mean RR (mean value of all R-R intervals in the sample), TP (total spectrum power ), LF/HF (vagosympathetic balance coefficient), HF% (relative power of high-frequency waves), LF% (relative power of low-frequency waves), VLF% (relative power of very low frequency waves). The height of the tree is correlated with mean RR, the density of the tree "branches" is associated with the R.M. Bayevsky’s tension index, the quantity of "branches" is determined by the total spectrum power, the tree inclination depends on the vagosympathetic balance: if LF/HF<1.5, the tree leans to the right, if LF/HF>2 - to the left, the spectrum structure determines the color of the tree: the percentage value of HF waves is green, that of LF - yellow/orange, and that of VLF - red. The signs of the subject’s optimal functional state are as follows: a high right-leaning tree with multiple and dense green branches. Table 1 shows the numerical values of the recorded HRV rates in the athletes, Fig. 1 - the same rates but in the form of a "Pythagoras trees", and Fig. 2 and 3 - in the Polar Flow and OMEGAWAVE software applications, respectively.
To interpret the data presented in Table 1, it is necessary to correlate the numerical values with the physiological standard, with obligatory correction for individual characteristics of an athlete, which requires a coach to possess relevant competencies. This option is informative for the coach, but it takes considerable time to process the results.
Table 1. HRV rates in three female athletes
|
Indicators |
Ye.V., 20 y.o., MS |
D.V., 21 y.o., MS |
А.А., 21 y.o, I category |
|
Mean RR. ms |
942.9 |
818.8 |
928.6 |
|
TI, c.u. |
42.5 |
123 |
24.3 |
|
TP, ms² |
5310 |
1352 |
8261 |
|
LF/HF |
0.66 |
0.84 |
6.34 |
|
HF% |
59.3 |
53.0 |
13.6 |
|
LF% |
39.2 |
44.3 |
86.1 |
|
VLF% |
1.5 |
2.2 |
0. |
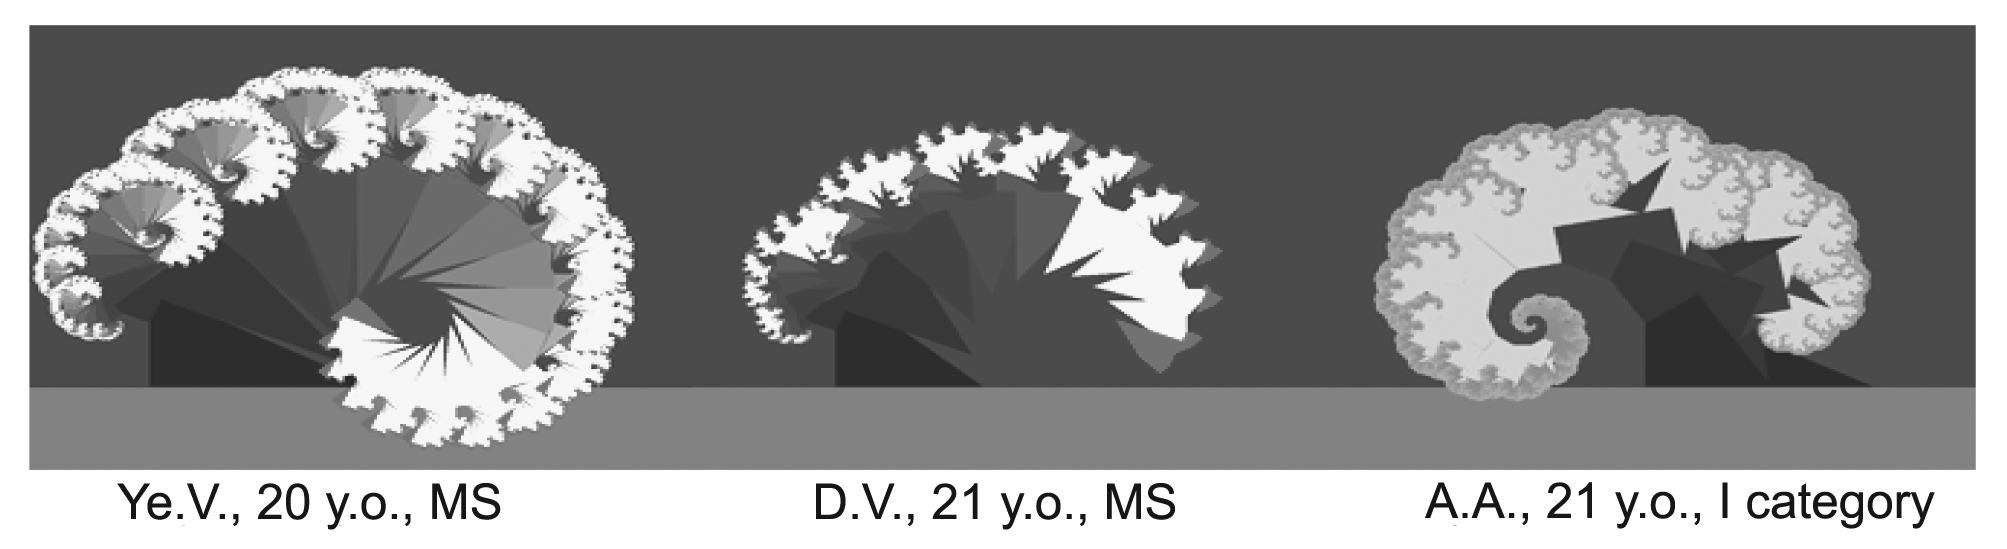
Fig. 1. Pythagoras trees built based on HRV rates in female athletes at rest
At the same time, according to Fig. 2 and 3, both coaches and athletes may take well-grounded decisions on how the further training process shall be designed and managed, with training volume, intensity and special focused rehabilitation tools, focusing on the color signals: green - ultimate readiness for training loads, yellow - evidence of the athlete’s functional degradation. The use of this HRV data visualizing method helps to determine the level of activity and degree of involvement of one or another mechanism of heart rate regulation, which is decisive in assessing the functional state of the athlete.
We assume that visualization of the data in the form of the Pythagoras trees not only demonstrates the degree of readiness for training loads but also indicates the level of activity and contribution of the heart rate regulatory systems, and thus, correction of the training and rehabilitation processes will be personalized.
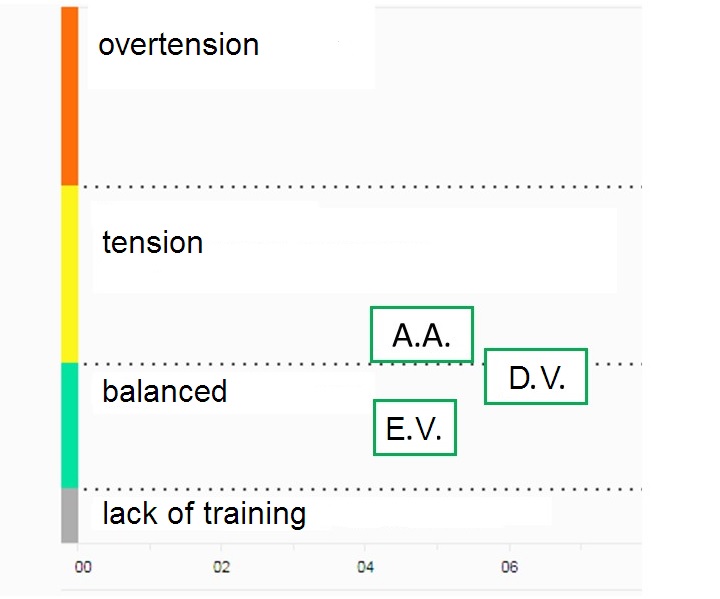
Fig. 2. Assessment of functional state of athletes based on HRV rated using Polar Flow computer program
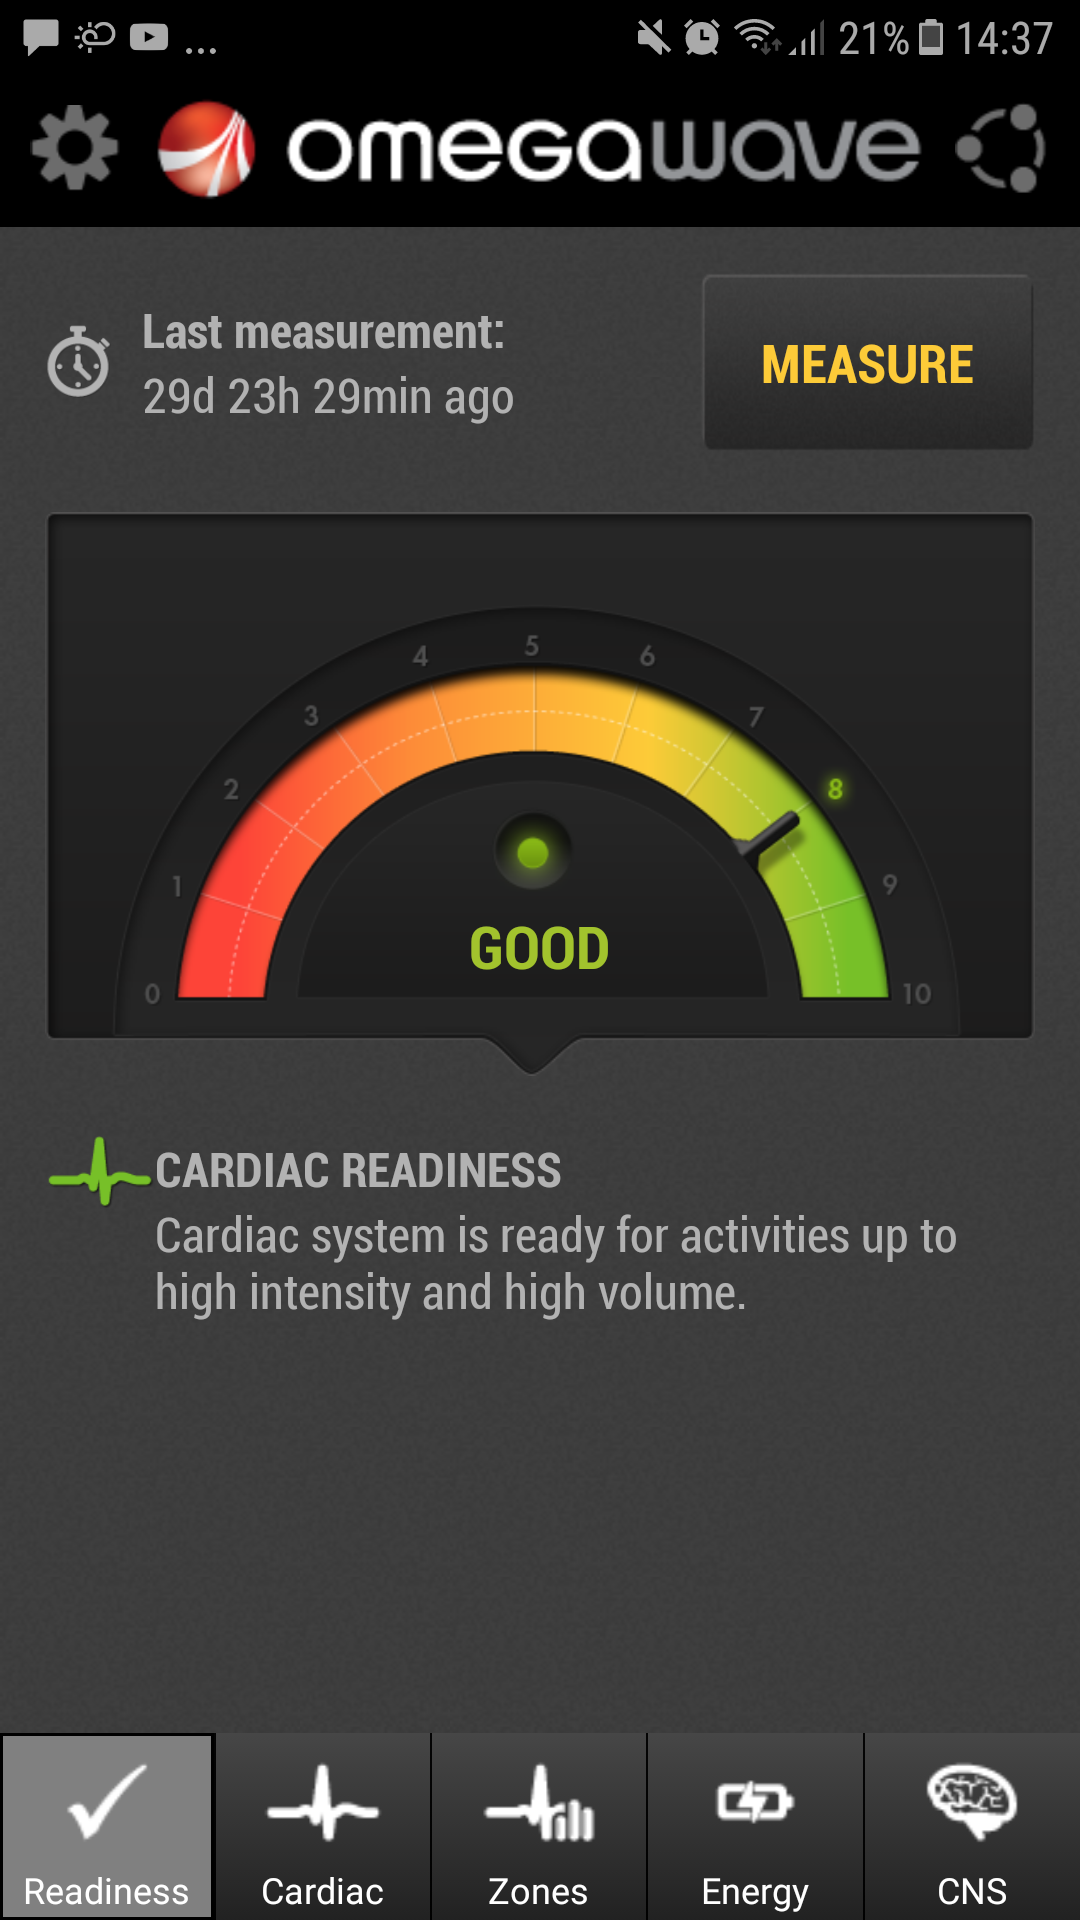
Fig. 3. Assessment of functional state of athlete (D.V.) based on HRV rated using OMEGAWAVE software toolkit
The proposed HRV data visualizing method was tested while recording HRV on land and in water. The findings suggest that in water (the subjects lay on the chest and breathed through a snorkel) the swimmers’ heart rate is increasingly affected by all levels of regulation. Thus, there is an increase in the statistical HRV rates and total spectrum power, At the same time, the level of activity of the sympathetic division of the autonomic nervous system increases too (there is an increase in the LF wave power and heart rate). The correlation analysis (the values of the coefficient of correlation are presented in Table 2) enabled to reveal a closer relationship between the HRV rates in water and on land among the Masters of Sports rather than the lower-skilled swimmers.
Table 2. HRV rates in swimmers on land and in water
|
Indicators |
MS, n=7 |
I-CMS, n=13 |
|
||||||
|
On land |
In water |
Coefficient of correlation |
On land |
In water |
Coefficient of correlation |
||||
|
Mean RR, ms² |
1018±64 |
897.5±50 |
0.6921 |
918±91 |
916.5±63 |
0.5160 |
|
||
|
TI, c.u. |
59.1±12 |
72.3±13 |
0.5730 |
58.1±22.8 |
78.5±29 |
0.3738 |
|
||
|
TP, мs² |
3666.2±1234 |
4982±2521 |
0.6544 |
3165.2±2179 |
5866±3108 |
0.5256 |
|
||
|
LF, мs² |
1971±947 |
2109±2968 |
0.7829 |
1239±1687 |
3202±3016 |
0.6119 |
|
||
|
LF/HF |
1.4±2.2 |
2.7±3.4 |
0.6314 |
2±2.4 |
2.9±4.3 |
0.5241 |
|
||
|
HF% |
48±11 |
43.0±24 |
0.5115 |
50±22.1 |
41.4±37 |
0.4971 |
|
||
|
LF% |
42.1±32.8 |
53.4±25.8 |
0.4426 |
47.5±22.5 |
58.7±29 |
0.4133 |
|
||
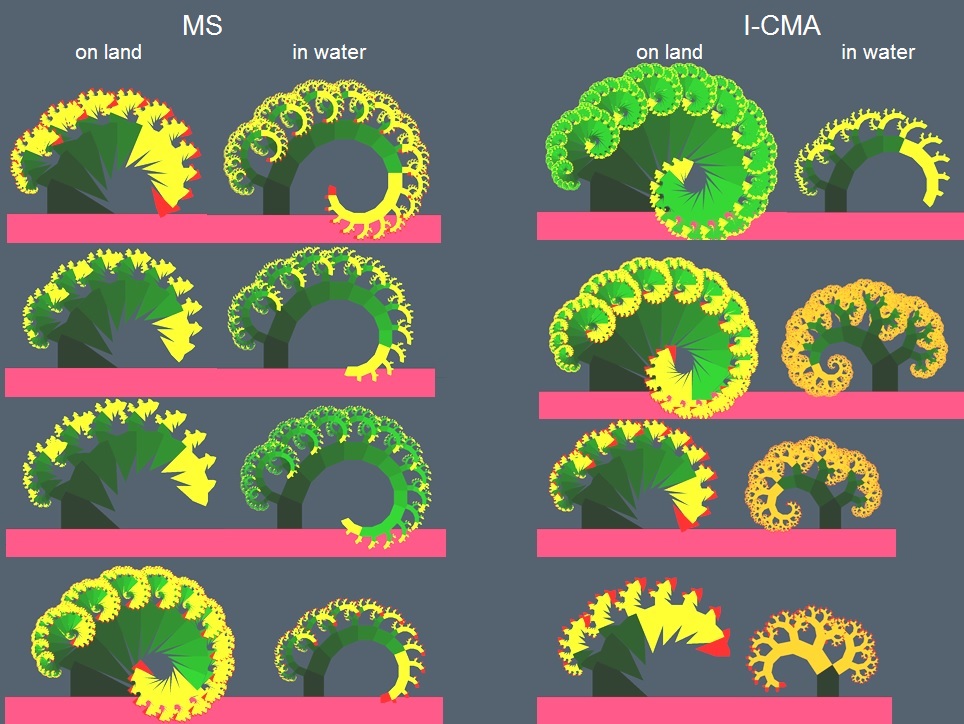
Fig. 4. Pythagoras trees of eight swimmers in water and on land (pairwise "land-water")
Conclusion. The proposed Pythagoras tree calculation and presentation method may be used as an additional tool to effectively manage the training and rehabilitation processes in elite sports.
References
- Bayevsky R.M.. Ivanov G.G.. Chireykin L.V. et al. Analiz variabelnosti serdechnogo ritma pri ispolzovanii razlichnykh elektrokardiograficheskikh sistem [Analysis of heart rate variability using different electrocardiographic systems]. Vestnik aritmologii. 2001. no. 24. pp. 65–87.
- Mikhaylov V.M. Variabelnost ritma serdtsa: opyt prakticheskogo primeneniya metoda [Heart rate variability: experience of practical application of method]. Ivanovo. 2000. 200 p.
- Shlyk N.I. Serdechny ritm i tip regulyatsii u detey. podrostkov i sportsmenov [Heart rate and type of regulation in children. adolescents and athletes]. Izhevsk: UU publ.. 2009. 259 p.
- Akselrod S.. Gordon D.. Madwed J.B. et al. Hemodynamic regulation: investigation by spectral analysis. Am J Physiol.. 1985; Vol. 249. pp. 867-875.
- Heart rate variability. Standards of measurement. physiological interpretаtion and clinical use. Task Forse of The Europеan Society of Pacing and Electrophysiology (Membership of Task Force listed in the Appendix). European Heart Journal. 1996. vol. 17. pp. 354-381.
Corresponding author: nataliya_lutkova@mail.ru
Abstract. The heart rate variability (HRV) data presentation tools are indispensable for the modern training and rehabilitation process management purposes since they give the means to rate the physical fitness and progress and assess contributions of the relevant bodily mechanisms. Of special importance for these purposes may be an algorithmic design of the Pythagoras tree with the tree height, inclination, color and branches (i.e. their quantity and density) indicative of the relevant test rates. Best physical fitness is described by a high, right-leaning tree with multiple and dense green branches. Based on the Pythagoras tree calculations and presentations, the coaches and athletes may take well-grounded decisions on how the further training process shall be designed and managed, with training volume, intensity and special focused rehabilitation tools. The study data shows that the higher are the athlete’s skills the more similar are the heart rate variability trees. The proposed Pythagoras tree calculation and presentation method may be used as an additional tool to effectively manage the training and rehabilitation processes in elite sports.


 Журнал "THEORY AND PRACTICE