Football data processing model in context of Russian national team participation in 2018 World Cup
Фотографии:

ˑ:
Postgraduate S.V. Mikhryakov1
PhD E.S. Naboichenko1
Dr.Hab., Associate Professor A.A. Polozov1
E.M. Bozhko1
1Ural Federal University (UrFU), Ekaterinburg
Keywords: football, national team, players, rating, management
Background. Modern football team (FT) management theory is largely based on accounts of technical and tactical actions (TTA), TTA success rates and high-to-top-intensity individual performance statistics. The TTA data to the team score correlation ratio is known to vary around 0.2 as was provided back in 1986 by M.A. Godik [1]. In basketball sport the situation is not much better with the correlation ratio estimated at around 0.34 [5]. A much better correlation ratio, ideally in excess of 0.6, is achieved by the expert/ coach assessments, with such a ratio being fairly sufficient for the practical team coaching purposes. It should be noted, however, that the team performance management resource of any coach is very limited in fact.
Subject to the study were 206 players of the national Football Super League, with their individual performances rated by 60 game elements/ criteria. The individual game success was rated by performance in every game component versus the numbers of contacts with the opponents; componential game efficiency; componential game intensity rated by the contacts with players in different game positions; contact success rate in different positions etc. Now if we just multiply 200×60×5, it gives us 60,000 values that need to be factored in the team performance analysis. Such an analysis may be designed to find, for instance, the most promising combinations from the 600 presently available in our football database. Such football data arrays are obviously too voluminous to be processed and efficiently analyzed by a single coach. Modern TTA databases (like Instat) accumulate the performance data of the past matches, but how could these data be successfully applied to an upcoming match with a new rival? For doing that, the available data arrays need to be projected on an abstract axis referred to hereinafter as the player’s componential rating or game level.
Objective of the study was to offer a football data processing model (DPM) and apply it to the 2018 World Championship.
Methods and structure of the study. The input data for the DPM were dominated by the individual contact win-to-loss ratios (‘balances’) of the Russian Super League players in 60 game components/ elements. A system of linear equations (SLE) was applied to process these ratios, produce the players’ ratings in every game component and generate specific forecast statistics for every upcoming match. The data analysis resulted in a best team composition for competing with the opponent’s line-up in the upcoming match based on the individual players’ contact win-to-loss ratios; recommended players’ substitutions and repositions in the upcoming match; recommended individual contacts for each player in each game component; and the most promising game combinations from those available in the database.
We used the input data of a single match-day in the Russian Super League (16/17), with the individual performance rates of the sampled 206 players in every game component to compose an ideal national Russian team. Based on the data processing and analysis, we secured the team total resource being upgraded from level 61 to level 16 to give the national team a fair chance to win at least the group tournament in the 2018 World Championship. Our Data Processing Model (see its detailed description in the study [5]) applies a few terms and definitions that differ from the traditional TTA meanings, as follow:
Game components mean mostly the actions in game contacts including back passes, dribbling, ball control in tough competitive situations, jump contact wins, ball captures etc.
Contact cost:
- Contact win cost means the surplus to the goal scoring chance, with the scoring point rated versus the starting point;
- In the Russian Super League, the contact win cost for the last defender is 4 times higher than for the halfback player.
Scoring rate:
- Any game combination is viewed as a sequence of won contacts crowned by a goal;
- Scoring rate means the ratio of actual goals scored by the player versus the expected score, with the individual ratio being negative in some cases even when goals are scored.
- The scoring rate depends on the relevant field point index determined by the horizontal and vertical angles and distance to the goal.
- The scoring rate is calculated separately for head shots, fixed right- and left-leg shots and aerial shots (including those with sliding tackles, inconvenient positions, strong low crosses etc.).
Tactics means the focused actions to redistribute game loads to efficiently target the strongest players on the weakest points in the opponent’s defence (within the specific game component). Tactical skill of a player may be interpreted as his ability to successfully take every chance in every game component.
Game (level) rating:
- We applied rating points to adequately rate the individual and team performances to generate the so called game level.
- Rating points are in direct correlation with the linear difference.
- The rating computation algorithm and SLE were selected so as to secure the highest match of the expected and actual game success rates/ scores.
Player’s rating:
- Player’s rating is assumed to be the same as the team rating conditional on the team being fully composed of such players;
- Player’s rating is determined by contact win costs with account of the field position indices rather than by a pure number of contact wins;
- Player’s rating normally exponentially falls versus the number of contacts, with different fall rates for different game components.
We analyzed under the study video-replays of match-day 9 of the 2016-17 Russian Championship to rate performance of the 206 elite players by 60 game aspects/ components. We selected of them 100 prospects for the national team, each of the prospects holding a Russian passport. An ideal national team was composed of these prospects with their individual and team loads and performances modeled for a hypothetical match with Zenit FC.
An individual game level is the fairly stable indicator as verified by the comparative analysis of the individual performance rates in a few matches: see Table 1. Thus 16 players of CSKA FC and Krasnodar FC showed quite stable individual ratings, with only 3 CSKA FC players tested with wide variations in the ratings/ game levels. It should be noted that the applied algorithm is highly sensitive to the scoring rate.
Table 1. Variations in the CSKA FC and Krasnodar FC players’ individual game levels/ ratings in match-day 9 of the 2016 Russian Super League and European Cup matches
|
CSKA |
Rostov |
Tottenham |
Krasnodar |
Schalke |
Rubin |
|||
|
9 |
Traore |
2957 |
3141 |
6 |
Granqvist |
2597 |
2426 |
|
|
24 |
Berezutsky |
2941 |
2901 |
9 |
Ari |
2459 |
2253 |
|
|
4 |
Ignashevich |
2783 |
3231 |
8 |
Gazinskiy |
2449 |
2137 |
|
|
25 |
Yeremenko |
2650 |
2701 |
11 |
Podberezkin |
2353 |
2336 |
|
|
17 |
Golovin |
2601 |
2808 |
98 |
Petrov |
2283 |
2027 |
|
|
66 |
Natho |
2586 |
2664 |
55 |
Yendzheychik |
2199 |
2399 |
|
|
8 |
Milanov |
2515 |
2509 |
22 |
Joazinho |
2186 |
2223 |
|
|
77 |
Kabore |
2153 |
2439 |
|||||
|
7 |
Toshich |
3032 |
2477 |
38 |
Kouassi |
2145 |
1996 |
|
|
42 |
Shennikov |
2320 |
2880 |
|||||
|
2 |
Fernandes |
2316 |
3014 |
|||||
Study results and discussion. Subject to the analysis were mostly the following matches of match-day 9 of the 2016 Russian Championship: Zenit vs. Spartak, Amkar vs UFA, Krasnodar vs. Rubin, Lokomotiv vs. Krylya Sovetov, Rostov vs. CSKA, Terek vs. Orenburg, Tom vs. Arsenal, and Ural vs. Anzhi.
Match analysis
It should be noted that F. Smolov and A. Dzagoev, the national team leaders, were not playing in the analyzed matches. A regular match is estimated to include 500-1000 contacts. The Russian Super League matches were analyzed to find the individual players’ shares of these contacts. The player’s individual ratings in every game component were found to fall exponentially, with some rather mid-level players showing extremely high game levels in some of the game components. As a result we selected the players as follows:

Players’ positions and recommended contacts per game components gave us the means to find the expected score of the RF National Team versus Zenit FC that makes 2.3 : 2.0. Now if the National Team composition is the same as in the last official match with Wales in the 2016 European Championship, Zenit FC is expected to win with the score of 2.6 : 3.03. The advantage of 1000*(2,3-2,0)/(2,3+2,0) = 70 is transformed to 1000*(2,6-3,03)/(2,6+3,03) = -77. This means that the national team composition we recommend herein promotes our team from place 60 to place 44 in the rating that is the team game level of the Denmark national team [2].
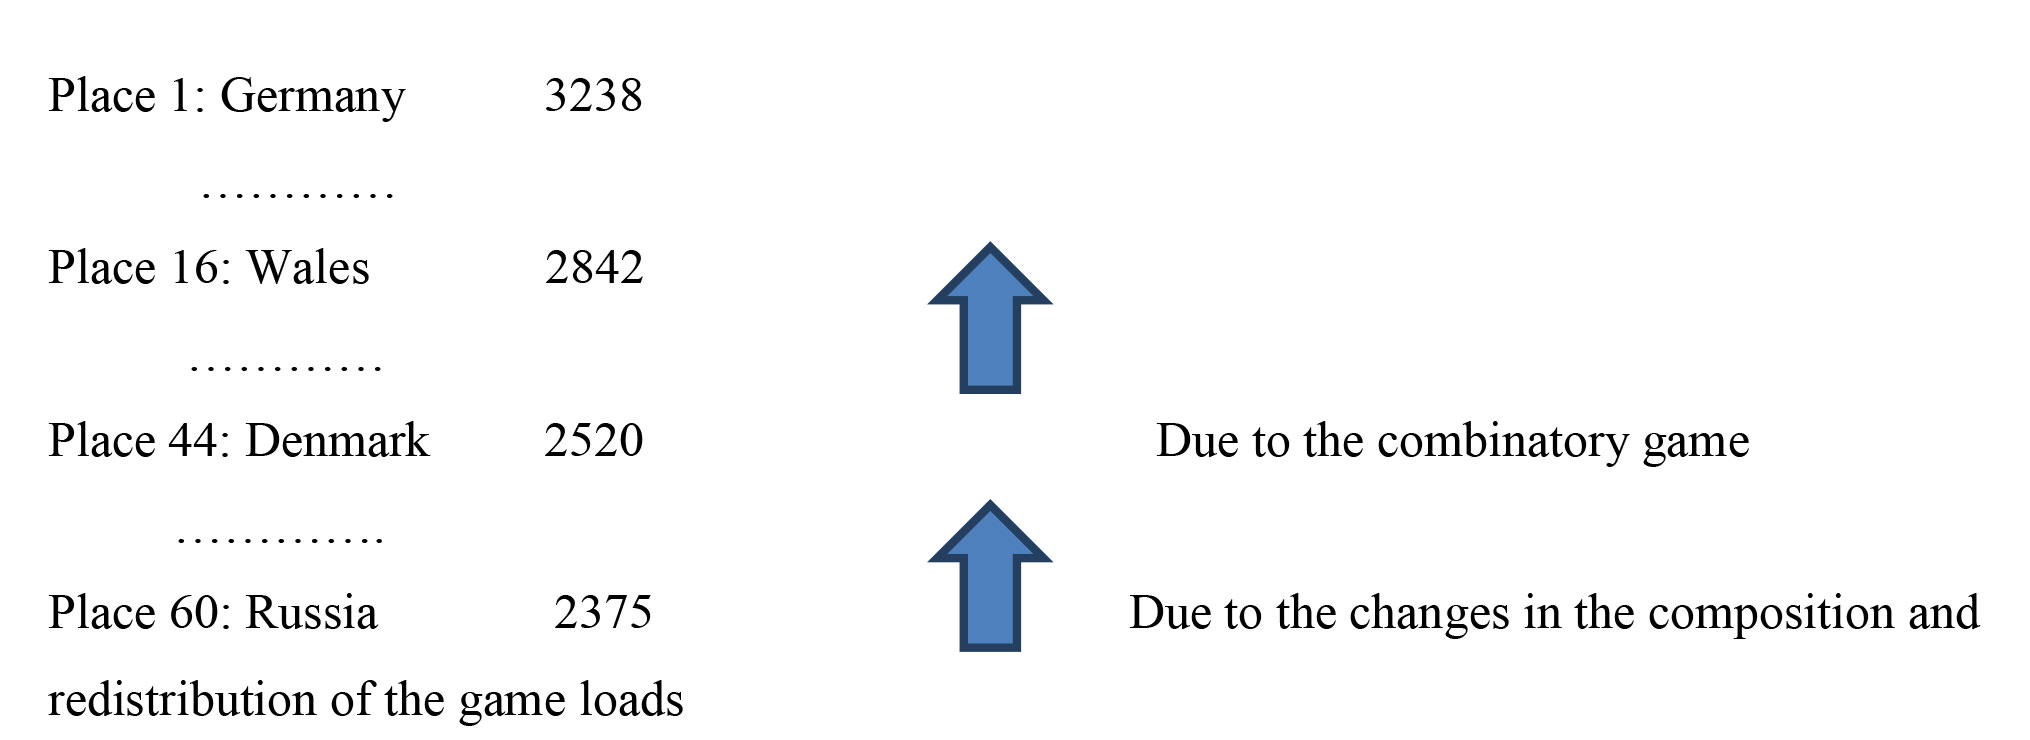
The score may be further improved by the combinatory game resource being mobilized within the frame of the standard football combinations to secure the most beneficial repositions with the highest wins in the rating points. Presently the DPM database gives 600 such combinations, with the computation algorithm making it possible to select the top-scoring combinations. A modern football team is estimated to generate around 150 attacks per match on average with an average scoring rate of 1%. In the analyzed cases, the scoring rate is 10-15 times higher in the best-case scenario. The summarized scoring rate of the selected combinations is in excess of 15 goals versus the 2 goals needed to make progress to place 16 in the world rating list in the hypothetic match under analysis. Such progress appears to be quite realistic: see Figure 1.
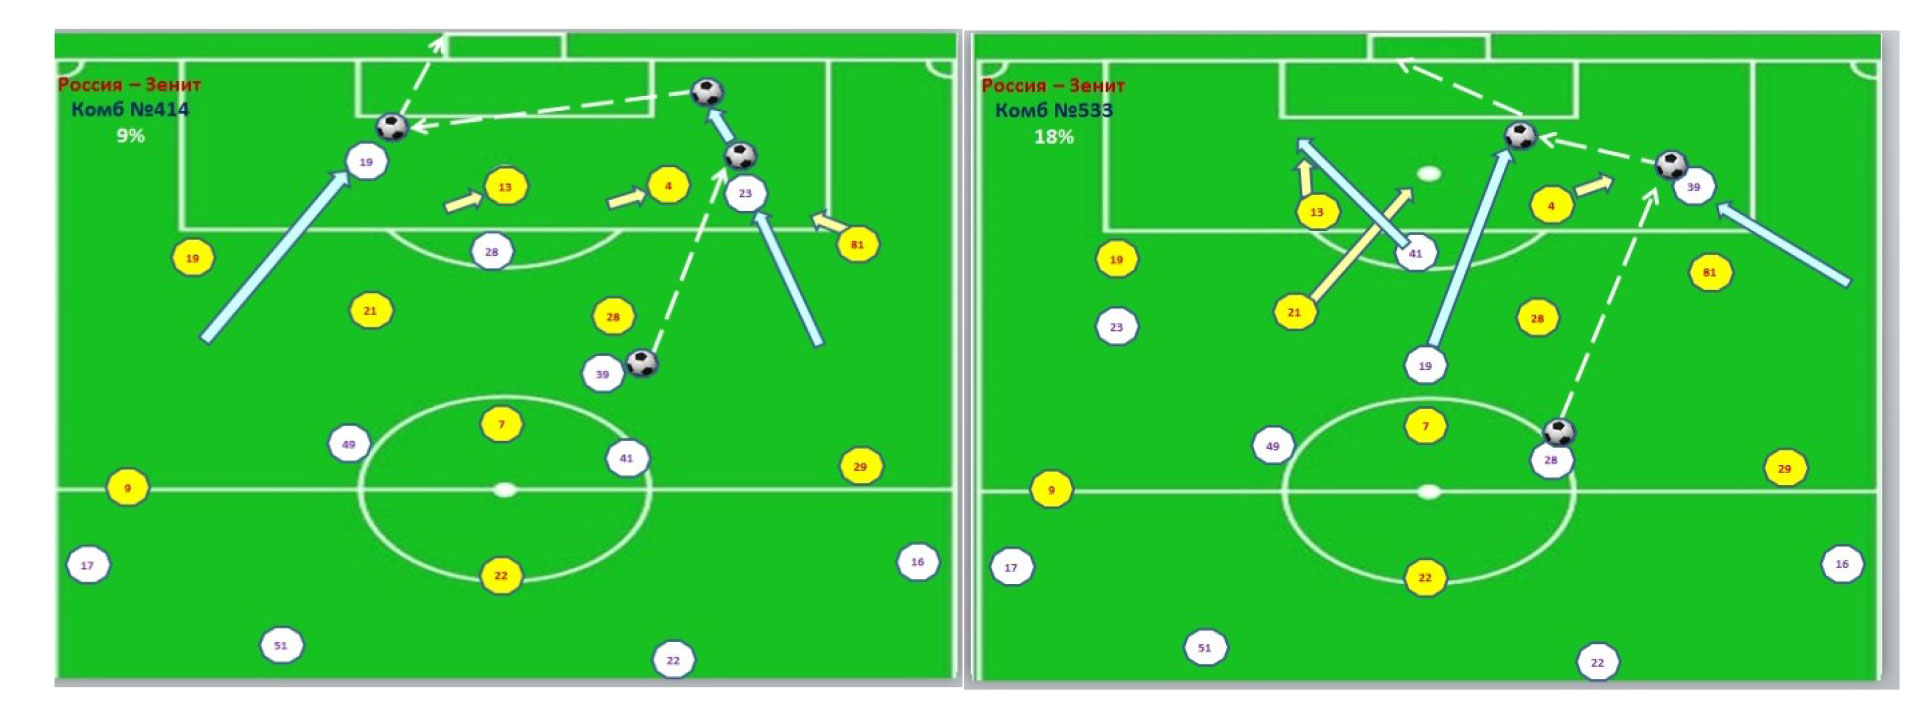
Figure 1. Some of the promising combinations for the Russian National Team with the scoring chances
We have tested the Data Processing Model in application to other team sports and found that the high potential benefits versus the actually achievable results give virtually no chance for a coach to compete with DPM: see Table 2.
Table 2. Actual and potential maximum DPM-assisted scores in different team sports
|
Team sport |
Match |
Actual score |
Potential score |
|
Football |
Arsenal vs. Manchester City |
1:2 |
4:2 |
|
Football |
CSKA vs. Tottenham |
0:1 |
2:0 |
|
Football |
Tom vs. Ural |
1:1 |
2:0 |
|
Handball, women |
Russia vs. Poland |
20:21 |
29:21 |
|
Futsal |
Gasprom vs. Sporting |
1:2 |
2,4:0,6 |
|
Basketball, women |
UGMK vs. PSK |
68:72 |
77:59 |
Subject to a special analysis was the payroll versus game level correlation, with 204 of the Russian Super League players being subject to the analysis as of October 2016. Having mined the payroll data for 34 players, we found the payroll versus game level correlation at 0.138 for the Russian Super League. We also found a regretful wage-leveling trend for most of the players with only a few exclusions for the national team leaders. As a result, the footballers are not much motivated for progress and foreign contracts and, hence, tend to behave as the government officers paid only for attendance. This plain fact shows why the Super League rated number sixth in the world by the financial flows produces the national team ranked only number 61. The only explanation is that the key problem of the national team is rooted far beyond the football field.
One more unexpected result of the study was the age versus game level statistics averaged for 20 performance criteria. Figure 2 hereunder shows two clear performance peaks for 24 and 28 years of age. It may be pertinent to mention in this context that records are almost never made in sprint and endurance-intensive races by 24+ and 28+ year old athletes, respectively. Therefore, we may assume that both of the peaks are due to some natural variations in the relevant physical qualities.
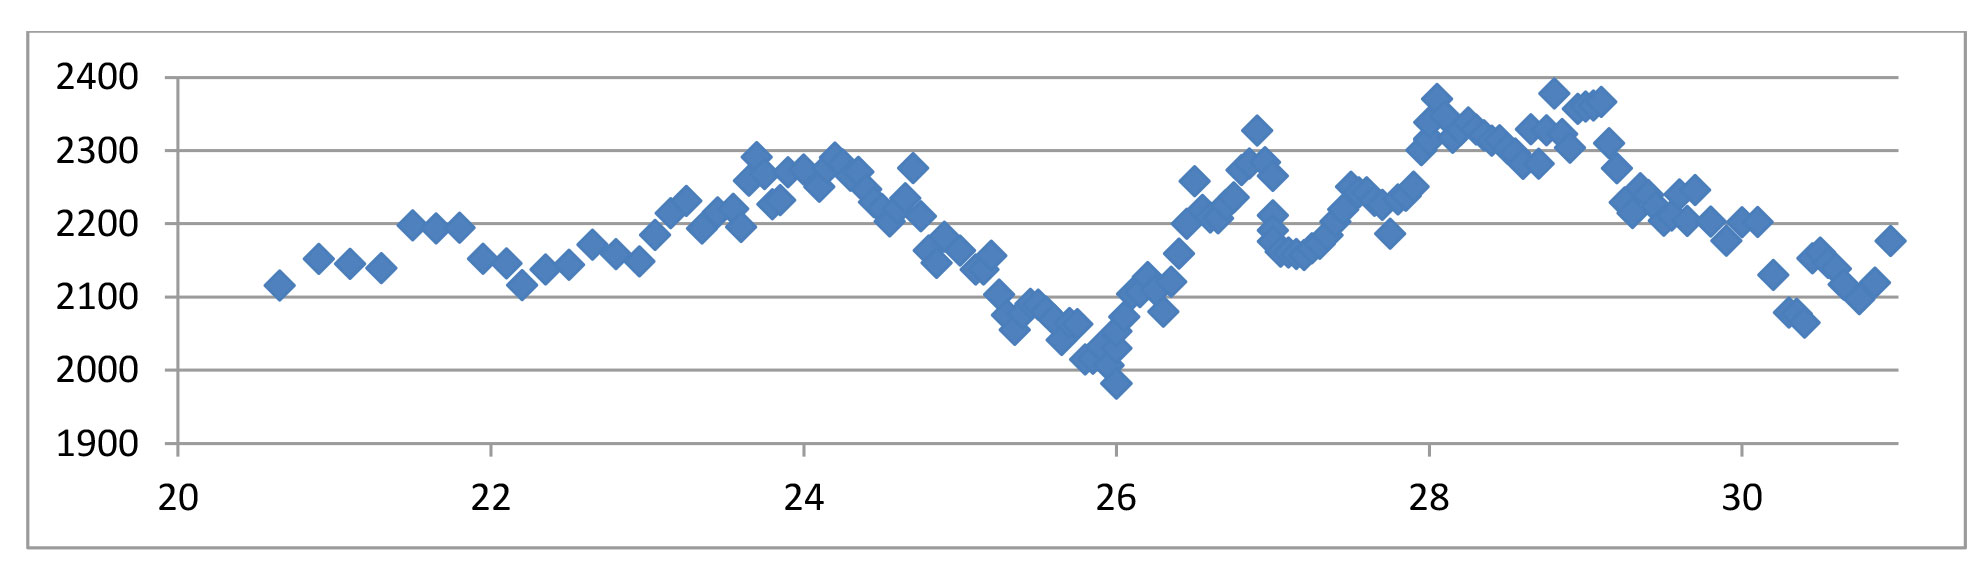
Figure 2. Age versus game level correlation for the Russian Super League players
Conclusion
- The main problem of any football coach is due to the fact that the modern football database has grown too wide and large to be effectively processed and managed by a single coach; and this is the reason why the modern team sports may soon have to resort to IT systems assisting to and even replacing the coaches.
- The Russian national football team is presently ranked only 61st on the world rating list. We applied a hypothetical match of the national team versus Zenit FC to demonstrate how the Data Processing Model may help the national team make progress to number 16 in the world rating to at least win the group matches.
- Since the Data Processing Model generates and operates the game level/ rating data, it gives the means to compute the best team compositions and game scenarios for every opponent in advance and flexibly adjust them. It should be acknowledged that any standard traditional game model fails to bring success to the national team ranked number 61 on the world rating list.
References
- Burov I.V., Polozov A.A. Innovatsionnaya sistema otsenki stepeni poleznosti igroka v basketbole [Innovative system to rate degree of benefits from basketball player]. V mire nauchnykh otkryitiy, 2011, no. 9.1(21), P. 363.
- Ezhednevny globalny on-line monitoring rezultatov sorevnovaniy za proshedshiy kalendarny god v igrovykh vidakh sporta i edinoborstvakh [Daily global on-line monitoring of competition results for last year in game sports and martial arts]. Available at: www.ra-first.ru.
- Polozov A.A. Takticheskiy effekt [Tactical effect]. Teoriya i praktika fiz. kultury, 2002, no. 6, P. 55.
- Savin S.A., Solovyev A.S. Futbol. Ezhegodnik [Football. Yearbook]. Moscow: Fizkultura i sport publ., 1986, 77 p.
- Karminsky A. Polozov A. Handbook of Ratings. Approaches to Ratings in the Economy, Sports, and Society. International Publishing house “Springer”, 2016, 360 p.
Corresponding author: d_narkhov@mail.ru
Abstract
The Russian national football team is presently ranked number 60-65 in the FIFA Coca Cola and www.ra-first.ru rankings. The team still faces problems of the individual player’s performance ratings and national team formation that have always been critical since 1960ies and are still addressed in statistics of the individual technical and tactical actions. The statistics, however, still shows poor if any correlation with the actual team competitive performance; and the above problems are still most effectively solved by the expert/ coach assessments. The football data processing model (DPM) we analyze and offer hereiun is more efficient than the traditional discretional decision-making models for it takes full advantage of the IT technology application in the modern sport design and management process.
Inputs for the football data processing model basically include the individual win-to-loss ratios (‘balances’) in game contacts for the Russian Football Super League players produced by analysis of 60 game elements. The individual game ratios were processed by a system of linear equations (SLE) to produce the players’ ratings classified by game elements; with an option of the ratios and ratings being computed for every upcoming match. The model gives the means to find the following: best team composition for a match as required to successfully compete with the opposing team; line-up of the team based on the individual contacts win-to-loss statistics; players’ substitutions and repositions over the match time; recommended numbers of the game contacts for every player in every game element; and the potentially most advantageous combinations as recommended by the database.


 Журнал "THEORY AND PRACTICE