Scoring chance taking rates in team sports
Фотографии:

ˑ:
Dr.Hab. A.A. Polozov1
E.G. Shurmanov1
Postgraduate S.V. Mikhryakov1
E.M. Bozhko1
1Ural Federal University (UrFU), Ekaterinburg
Keywords: basketball, football, ice hockey, scoring rate
Background. Scoring rates are widely applied by the modern football and ice hockey analysts albeit they generally apply to the players acting in the same field positions (InStat), with a special emphasis on the forwards’ scoring rates. The Continental Ice-hockey League scores differently the actions of forwards and defenders. In modern basketball, a player Performance Index is reported including the specific (bracketed) rates, namely the missed 2-point shot rate (-1), missed 3-point shot rate (-1.5), and missed penalty shot rate (-0.8). The Continental Ice-hockey League scores a goalkeeper performance using a few criteria with a special priority to the reliability rate i.e. the average save percentage per match – albeit it should be noted that it largely depends on the team performance on the whole. Two equally skilled goalkeepers may show different save percentages depending on the defenders’ performance, for instance. Field players’ performance is largely rated by the scoring index which is heavily dependent on the player’s field position i.e. widely different for the forwards versus defenders.
Objective of the study was to give a new high-quality criterion to rate the field players’ and goalkeepers’ performance by the actual scoring chances versus goals i.e. scoring (chance taking) rate.
Study results and discussion
Field position index
Let us assume that we are in some point on the field r meters afar from the goal centre, with the goal being visible from this point at horizontal angle α and vertical angle β. It is clear that the higher are the angles α and β the higher is the scoring chance; and the higher is the ball speed ν, the shorter is the ball travel time τ to the goal. Let us attribute the following φ index to each field point (see Figure 1):
Figure 1. Field position index calculation formula
Every parameter in the above formula, with the only exception for the ball speed, directly refers to the field point where the scoring chance is taken. If we now take the middle point in between the goalposts for the base point, every field point may be represented by its projection on the base line and perpendicular line (а axis). Thus the field point index for football may be calculated as follows:
Using the above formulae, we produced the field position diagrams for football, futsal, handball, ice-hockey and basketball: see Figures 2 and 3.

Figure 2. Football field position indices
Figure 3. Basketball field position indices
Furthermore, isometric lines of the same indices may be drawn as follows: see Figure 4.
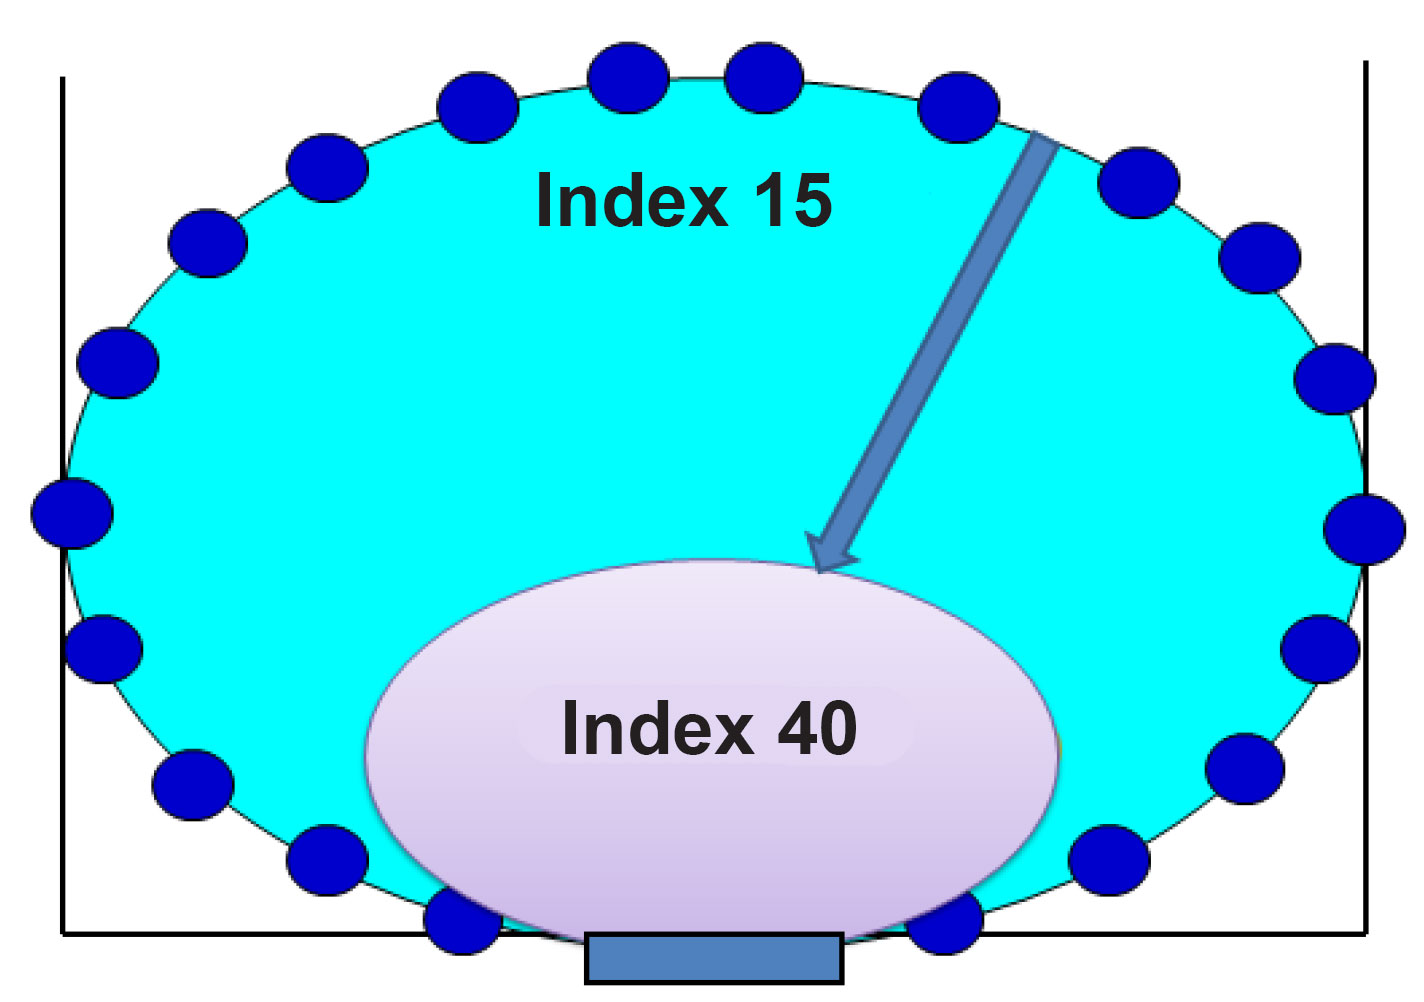
Figure 4. Isometric lines of the equal indices
Success in modern team sports depends on how successful players are in contacts with the opponents fighting for positions on the field giving a scoring chance and in taking these chances. If we assume every player on the field having the same shooting power (i.e. the ball speed), we will find the scoring chance (р) and field index (φ) being in a simplified linear correlation. Furthermore, correlation of both parameters may be defined by the following saturation curve:
Р = 1 – ехр( -Ψо/A). (3)
А rate characteristic of the tournament on the whole rather than every competing team in particular is the most problematic for calculation of the above values. For practical calculations we mined scoring statistics of every team for every event, with A parameter being applied in denominator to produce an integer value. Given in Table 1 hereunder are the A rates for different sport superleagues.
Table 1. A rates for different sport disciplines
|
Sport |
Matches |
ψ |
Range |
|
Football |
Rostov vs CSKA, 2016 Russian Championship |
141 |
|
|
|
Arsenal vs Manchester, 2017 UK Championship |
136 |
|
|
|
Zenith vs Spartak |
111 |
|
|
Futsal |
Russia vs Spain, 2017 World Championship |
119 |
75 – 120 |
|
|
Gasprom vs Sporting, 2017 Champions League |
132 |
|
|
|
Sibiryak vs KPRF, 2016 Russian Championship |
51 |
|
|
Handball |
Russia vs Germany, men, 2015 World Championship |
52 |
30-80 |
|
|
Russia vs Poland, women, 2016 European Championship |
71 |
|
|
|
Permskie Medvedi vs Neva, men, 2015 Russian Championship |
34 |
|
|
Ice hockey |
Metallurg vs Lev, KHL 2-14 |
264 |
250-305 |
|
Basketball |
UGMK vs USK, Prague, women, 2015 2017 Champions League |
32 |
|
|
|
Olympiacos - Anadolu Efes, 2017 Championship |
66 |
|
It should be noted that the above values were calculated assuming the vertical and horizontal shot angles being maximal. In actual practice, ball may land not only in the corner but in any point between the goalkeeper and goalpost, with the actual values of the vertical and horizontal angels being much lower. Therefore, it may be stated that a specific index may be ascribed to every field point as the base characteristic of the shot on goal computable by the relevant formula. It should also be mentioned that the goalkeeper may vary the index by moving towards the scorer thereby minimizing the hittable area of the goal, with the formal field point index being reduced in the case. Now we can convert the field point indices into the scoring rates. Let us present hereunder the simplified picture of the scoring chance taking process.
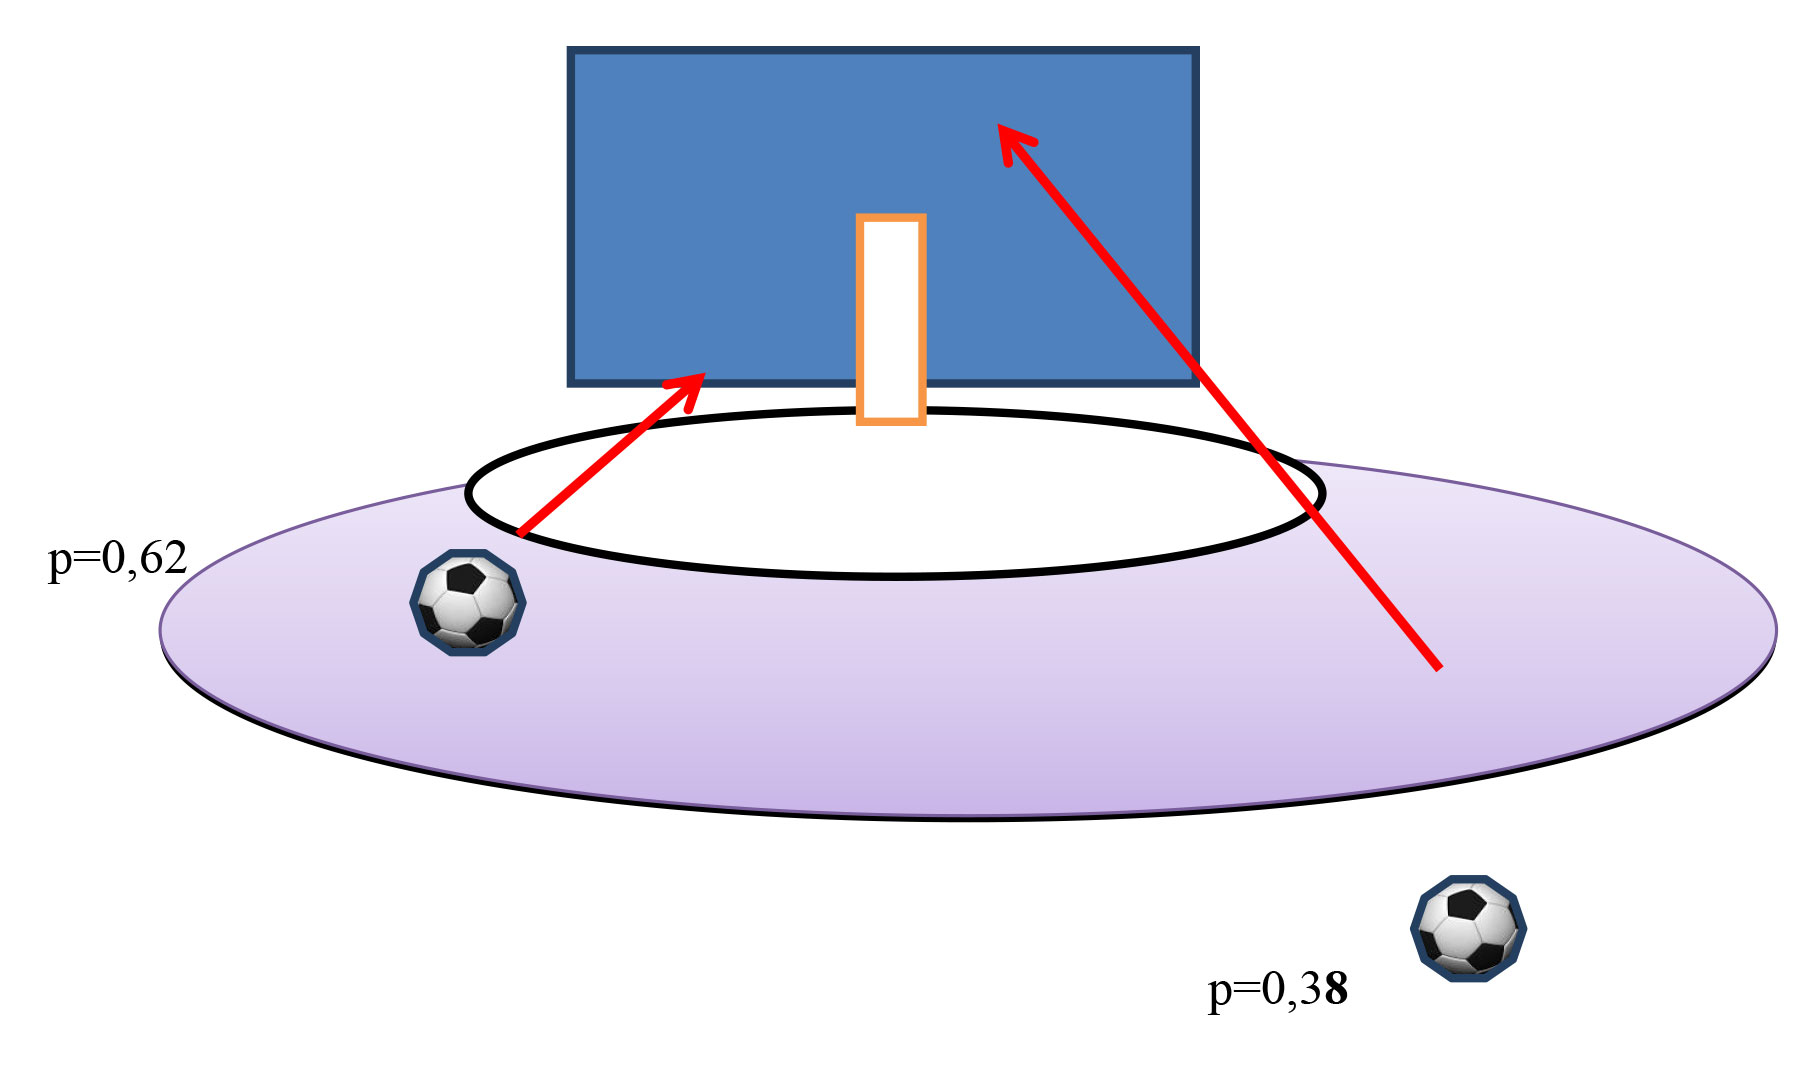
Figure 5. Forward’s/ goalkeeper’s performance rate i.e. the expectable versus actual goals ratio
In case when the forward is expected to score 0,32+0,68 = 1 goal but fails, it means that the +1 point is added to the goalkeeper performance rate and -1 point is deducted from the forward’s performance rate. In modern ice hockey, separate statistics is run for bullets. As demonstrated by the latest futsal statistics, the face-to-face scoring chances are taken in only 9-11% of the cases.
One more complicating aspect of the calculations is that we assume the scoring situations in each field point being identical although they may differ. Let us give examples from the basketball practices where the 6+ meter throws are scored by 3 points, with the scoring rate in the men’s basketball now varying around 40%; with personal fouls penalized by penalty throws with the scoring rate of 72%. The field points close to the hoop are assumed to give a 100% scoring chance albeit the actual reported scoring rate varies at 30-40%. These variations may be due to the fact that the 3-point throws are normally made with the ball kept by two hands with the relevant stable motor stereotype being applied. In close contacts with the opponents, the players often have to throw with one hand, with body deviation, when falling down etc.
Therefore, throws shall be duly classified for the scoring statistics purposes. In modern handball, throws are classified at least into running and standing throws. In football they are classified into at least left- and right-leg kicks, with the left-leg kicks generally second by the scoring rates, and the head shots even worse by these rates. This means that the similar calculations shall be made for every type of shots on goal.
Table 2. Examples of scoring rate application in different sports
|
Sport |
Match |
Match |
|
|
Football |
Zenith vs Spartak |
Rostov vs CSKA |
|
|
|
Head shots |
151 |
350 |
|
|
Left-leg shots |
75 |
44 |
|
|
Right-leg fixed shots |
85 |
37 |
|
|
Right-leg aerial shots |
132 |
132 |
|
Futsal |
Gazprom vs Sporting |
|
|
|
|
10m shots |
212 |
|
|
|
Left-leg shots |
99 |
|
|
|
Right-leg fixed shots |
87 |
|
|
|
Right-leg aerial shots |
192 |
|
|
Basketball |
Olympiacos vs Anadolu Efes |
|
|
|
|
1-point penalty throws |
9,0 |
|
|
|
2-point fixed throws |
185,3 |
|
|
|
3-point fixed throws |
5,3 |
|
|
|
Aerial throws |
1045,4 |
|
The above study data and considerations show the importance of the game contact cost being duly factored into the calculations to find correlations of the contact success with the points on the scoreboard. For example, every individual contact won by a halfback in football costs 4 times less than that won by a forward.
Conclusion
- As things now stand in modern team sports, scoring indices mean the ratio of actual goals to scoring chances for forwards and the save percentages for the goalkeepers, with these rates being too general for practical application.
- Every team sport is designed to win the individual game contacts so as to achieve the best field point and take the scoring chance. Since the scoring rate depends on the field point, every point may be indexed by multiplying the vertical and horizontal goal view angles and dividing them by the distance to goal. Having the background statistics for every team of the relevant league, the field point indices may be converted to the goal scoring chances/ rates. Thus, having the expected and actually scored goals, we may obtain an individual scoring rate for every player, with the scoring rate being in some cases negative for a high-scoring player despite his/ her high game score.
- Shots on goal need to be classified by the actual shooting conditions. In case of football, for instance, the data shall be classified at least by the head/ left/ right leg shots and shots from non-standard positions (sliding tackle, jump shot, body rotation shot etc.).
References
- Polozov A.A., Karminskiy A.M., Ermakov S.P. Entsiklopediya reytinga: ekonomika, sport, obschestvo [Encyclopedia of rating: economy, sport, society]. Moscow. Ekonomika i zhizn publ., 455 p.
- Karminsky A., Polozov A. Approaches to Ratings in the Economy, Sports, and Society. Springer publ., 2016, 360 p.
Corresponding author: d_narkhov@mail.ru
Abstract
Scoring chance taking rates applied in modern team sports are generally estimated as the total shots on goal versus actual goals in percentage terms. The scoring rate is known to depend on how skilful and successful the goalkeeper of the opposing team is, on the shooting point, applicability of one or another shooting stereotype etc. Any modern team sport is designed to deliver the ball/ pack to a certain point on the playground to help take the scoring chance, albeit the actual scoring index can hardly be computed. The study offers a frame individual scoring chance rating algorithm to help the coaches manage the teamwork based on these rates. The authors made a conclusion that the scoring statistics needs to be classified by the actual shooting conditions. In case of football, for instance, they shall be classified at least by the head/ left/ right leg shots and shots from non-standard positions (sliding tackle, jump shot, body rotation shot etc.).


 Журнал "THEORY AND PRACTICE