Standardization and classification of athletes’ working capacity rates versus skill levels
Фотографии:
ˑ:
Dr.Hab., Professor E.A. Shirkovets1
Dr.Hab., Professor B.N. Shustin1
1All-Russian Research Institute of Physical Culture and Sport, Moscow
Keywords: athletic performance tests, correlations of energy supply components, aerobic capacity rates.
Introduction. The norm is defined in research practice as an ideal object with established objective quantitative characteristics. In sports, identification of individual differences in physical performance indicators serves a starting point for effective training process management [1-3].
Objective of the study was to analyze correlations of the quantitative energy supply rates and their effects on competitive accomplishments.
Research methods and structure. The development of regulatory characteristics of working capacity of athletes that have had many years of training in one of the cyclic sports in this paper is based on the results of testing conducted in standard laboratory conditions. Test results of a large number of male athletes (n = 360) with qualifications ranging from Candidate Masters of Sports to Masters of Sports, International Class Masters are presented. Results of two types of tests were analyzed, the physical loads were performed on a cycle ergometer. In the first test, the load was increased stepwise every three minutes and continued to failure, individually for each subject. As a result of the ergometric analysis of the obtained data the load intensity that made the subject reach the maximal О2 consumption was determined. Using this load which is usually defined as critical, the subjects performed the second test that determined their maximum aerobic capacity [2].
The following representative indicators of the athletes’ functional capabilities were analyzed: maximal performance time in the tests, aerobic performance rates, anaerobic performance rates with lactic and alactic О2 debt rates determination, ergometric indicators by which zones of physical loads with different physiological effects on the body were differentiated, as well as the rate of recovery of the body after strenuous muscular exercise.
Results and discussion. Table 1 presents statistical characteristics of the indicators that reflect in a generalized form the functional capabilities of the subjects.
Table 1. Performance indicators of athletes (n = 360) when tested on a cycle ergometer with a stepwise increasing load, performed to failure
|
Indicators |
t (minute) |
W (watt) |
maxVo2 (l/min) |
Vо2 (anaerobic threshold) (l/min) |
∑O2D (l) |
|
Mean values |
14.05 |
331.2 |
4.88 |
3.46 |
9.94 |
|
Standard deviation |
1.86 |
49.90 |
0.66 |
0.43 |
2.47 |
|
Variation coefficient (%) |
13.24 |
15.09 |
13.46 |
12.50 |
24.90 |
The table gives us an idea of the distribution of the functional data of the athletes involved in the research. The average level of aerobic capacity was 4.88 ± 0.66 l/min, the total oxygen debt – 9.94 ± 2.47 l. Such indicators significantly exceed the physiological norms characteristic of untrained healthy subjects. Figure 1 shows an average diagram of О2 consumption with a 75-watt load increase every 3 minutes of exercise. The exercise was performed within the range of loads from 75 to 450 watts (or 2,700 kgm/min). The upper curve (1) shows the dynamics of О2 consumption with increasing intensity of exercise, reaching the asymptotic level makes it possible to determine the critical intensity. The second curve (2) shows the dynamics of СО2 excess, the analysis of which results in the anaerobic threshold localization being diagnosed [2]. All the subjects had extensive experience in specialized training, so these indicators can characterize the norm of aerobic reactions of athletes specializing in the cyclic sports to controlled exercise.
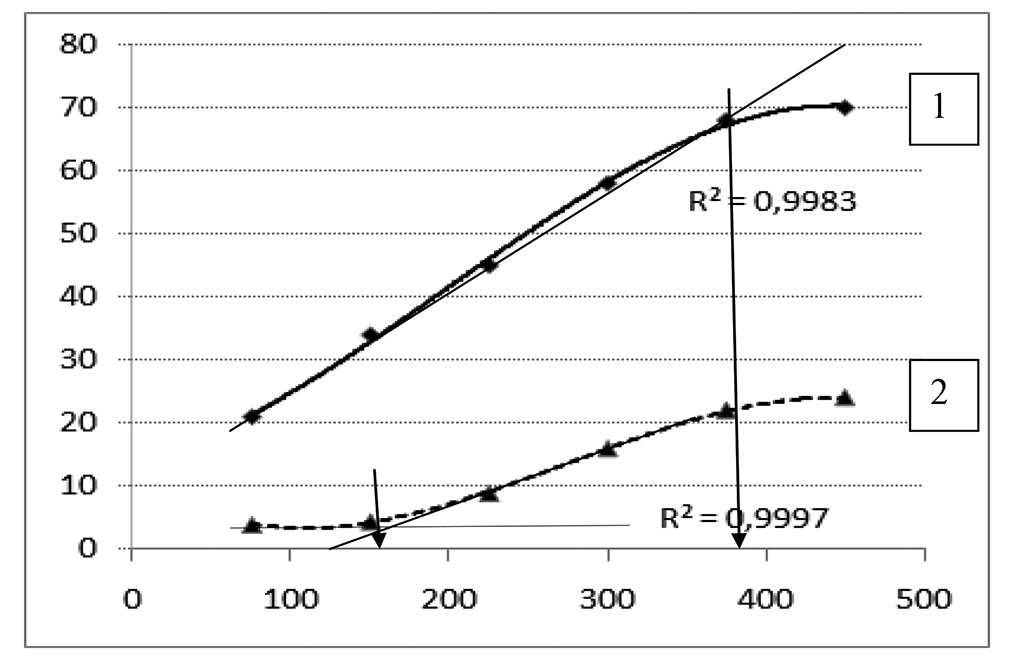
Figure 1. A generalized diagram of the mean rates of О2 consumption (1) and СО2 excess (2). Threshold and critical power assessment during standard testing is shown. X-direction is performance capacity (watt), y-direction - Vo2 and Exc СО2 values (ml/min/kg)
Statistical processing revealed that the data were distributed normally at each stage of the exercise. Hence, going beyond the limits of two or three sigmas will mean a significant deviation of individual values from the norm. The curve shows a linear increase in О2 consumption within the load range of 75-350 watts from 22 to 60 ml per 1 kg of body weight on average. With increasing exercise intensity the standard deviation from the average values increased from 4.0 ml/kg during the first stage of the exercise to 6.5 ml/kg during the fourth stage, that is, the spread of the standard deviations from the average values increased.
Asymptotic slowdown in the increase of the О2 consumption is observed during high intensity exercise. The average value at the 5th stage was 67 ml/kg, at the 6th – 70 ml/kg. The highest values of oxygen consumption were recorded during the last minutes of the exercise. It should be noted that out of 360 subjects, 90 individuals were able to continue through the 6th stage, while the rest stopped at the fifth stage.
According to the absolute values of oxygen consumption during the testing, all the subjects were divided into 6 groups – from 4.0 l/min to 6.0 l/min with the level of 0.5 l/min by group, respectively. This method of distributing the subjects by the level of aerobic capacity was used to determine the interrelation between the working capacity rates in relatively homogeneous aerobic capacity groups.
Maximal oxygen uptake indicator is adopted as the standard of human cardiorespiratory performance in the international practice of functionality assessment [4-6]. Based on the obtained statistical characteristics of the data, using them as standards, we can differentiate the approach to assessing the testing results, correlating the amount of exercise performed to the efficiency of its bioenergy supply.
The interrelation of aerobic capacity and other performance indicators was revealed in the six groups of athletes that were analyzed. The total oxygen debt value increased from 7.5 to 13.0 l in the high-aerobic-potential-group subjects. The critical power increased from 265 to 400 watts, the threshold power – from 150 to 230 watts, the performance duration in the standard test – from 12 to 16 minutes. It should be noted here that all of the above are correlated with the absolute body weight values of the subjects whose average numbers varied from 72 to 81 kg in the six groups. Naturally, the analysis of these dependencies will look different in calculations per body weight unit.
Considering the significant variability of these parameters, their correlation links in different groups of subjects were examined. The closeness of mutual variations of the maximal О2 consumption with the indicators of oxygen debt, critical power and performance time limit during the testing shows a tendency to decrease from the 1st to the 6th group in all cases, that is, the interdependence of these indicators decreases as the aerobic capacity of the subjects increases (Figure 2). The opposite picture is revealed in a similar assessment of the correlations between the value of the О2 debt and the performance time limit in the test with a stepwise increase in the load.
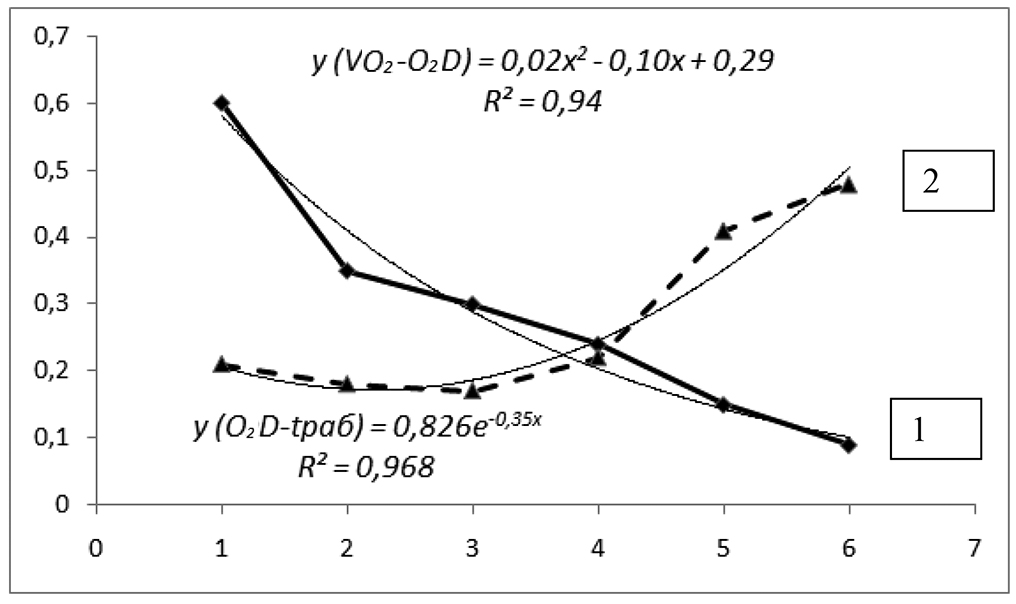
Figure 2. A diagram of coefficients’ correlation between max VО2 and ∑О2-debt (1), as well as between ∑О2-debt and performance time limit calculated for the subjects of 6 groups with different levels of aerobic capacity. X-direction is the group number, y-direction – correlation coefficients.
Such a change in the closeness of interrelations of the considered indicators can be interpreted as follows. For athletes with a low aerobic capacity the high-intensity muscular work is ensured by the parallel strain of the bio-energy systems under consideration. These indicators vary more and more independently as the aerobic power increases, which leads to a decrease in the values of the correlation coefficients. The opposite tendency is observed when comparing the correlation coefficients of the performance time limit in the step power growth test with the ∑О2 debt indicators. In this case the closeness of the connection increases from the 1st to the 6th group from 0.2 to 0.5 as the aerobic capacity of the subjects increases.
Conclusion. Statistical data analysis gives the means to assess and standardize the physical working capacity rates. The study data of that kind may be particularly beneficial for the cyclic sports where competitive performance is largely dependent on the athletes’ aerobic resources.
References
- Vazin A.N., Sorokin A.P., Sudakov K.V. Kolichestvenny sistemny analiz razlichnykh rezhimov intensivnoy myshechnoy nagruzki [Quantitative system analysis of different modes of strenuous muscular exercise]. Uspekhi fiziol. nauk, 1998, no. 9, 3, pp. 133-148.
- Volkov N.I., Shirkovets E.I. Ob energeticheskikh kriteriyakh rabotosposobnosti sportsmenov [Energy criteria of athletes' performance]. Bioenergetika (Bioenergetics). Leningrad, 1973, pp. 18-30.
- Shirkovets E.A., Titlov A.Y., Lunkov S.M. Kriterii i mekhanizmy upravleniya podgotovkoy sportsmenov v tsiklicheskikh vidakh sporta [Criteria and mechanisms for managing athletes' training process in cyclic sports]. Vestnik sportivnoy nauki, 2013, no. 5, pp. 44–48.
- Davis James A., Storer T.W., Caiozzo V.J. Lower reference limit for maximal oxygen uptake in men. Clin. Physiol. and Funct. Imag., 2002, 22, no. 5, pp. 332-338.
- Demarie, S., Quaresima, V. VO2 slow component correlates with vastus lateralis de-oxygenation and blood lactate accumulation during running. J. Sports Med. and Phys. Fitness, 41, no. 4, 2001, pp. 448-455.
- Holman R. The Theory and Practice of Endurance Training. Quart. Review, 1999, 79, pp. 3-5.
- Rusko H., Havu M. Aerobic performance capacity in athletes. J. Appl. Physiol., 1998, 38, 2, pp. 151-159.
- Turner A., Cathcart A. Oxygen uptake and muscle desaturation kinetics during intermittent cycling. Med. Sci. Sports Exerc. 38 (3), 2006, pp. 492-503.
Corresponding author: vniifk@yandex.ru
Abstract
The article considers correlations of the quantitative energy supply rates and their effects on the competitive accomplishments. Two athletic functionality test models were analysed under the study, the first model implying step power growth, and the second using pre-set time of the critical-power workload. The test models were applied to a representative sample of highly-skilled athletes to better understand the correlation of the bio-energy parameters with high-intensity muscular work. Statistical data analysis gave the means to assess and standardize the physical working capacity rates. The study data of that kind may be particularly beneficial for the cyclic sports where competitive performance is largely dependent on the athletes’ aerobic resources.


 Журнал "THEORY AND PRACTICE