Magnetic and electrical stimulation of human neuromuscular system: comparative analysis
Фотографии:

ˑ:
Postgraduate student S.A. Fedorov
Applicant A.G. Belyaev
Postgraduate student Yu.V. Sharkova
Velikie Luki State Academy of Physical Culture and Sport, Velikie Luki
Keywords: magnetic stimulation, electrical stimulation, H-reflex, M-response.
Introduction. When potential opportunities of one or another group of stimulating impacts are explored and applied to study physiological mechanisms of motor activity; or to purposefully control some conditions of human body and/or vary specific qualities of some of its systems, the most appropriate factors of the stimulating impacts are always to be found and they are always ranked among the top priorities by the researcher [4]. The available literature, on the one hand, provides quite detailed information on the applicable electric stimulation parameters when the stimulation is applied for target modification of some bodily motor qualities with registration of the muscle responses to the stimulating impacts [1, 2]. On the other hand, the available data on the high-intensity magnetic stimulation parameters are very poor and mostly relate to the magnetic stimulation effects on different body systems to cause sound induced motor responses from the upper and lower limb muscles [5]. With this knowledge in mind, we believed it would be a reasonable and grounded to complete a comparative analysis of the magnetic/ electric stimulation effects on the human muscular system and thereby obtain a reliable set of the high-intensity magnetic stimulation process parameters applicable for controlled transformation of human neuromuscular system qualities to the desired degree.
Materials and methods. In the first set of experimental tests, we studied variations of the evoked muscle response parameters (namely Н-reflex and M-response) when growing single magnetic and electric impacts were applied to n. tibialis muscle. 9 male volunteers of 18 to 22 years of age were subject to the tests. The tested individuals were requested to lie on a coach face down. The active stimulating electrode was fixed in the n. tibialis projection point, whilst the indifferent electrode was attached to the front surface of the thigh. The recording electrodes were fixed on m. soleus (SOL) and medial head of m. gastrocnemius (GM) muscle.
In the first stage of the tests, we determined the threshold pulse level required to trigger an H-reflex or M-response. Normally it was the Н-reflex that was registered first, although some individuals showed the opposite pattern with M-response coming first and followed by H-reflex.
In the second stage, we recorded the evoked muscle responses when the stimulating pulses were raised in a stepped manner by 10% every time, with the relaxation time of 30 seconds in between the pulses, and with the intensities of the background pulse and the following pulses being adjusted on an individual basis. The electric stimulation tests were followed by the magnetic stimulation using Magstim-200 Stimulator Unit equipped with 50mm flat coil, with the coil center being placed in the n. tibialis muscle projection point. The data recording sequence for the magnetic stimulation test was the same as for the electric stimulation tests. Maximum output of the Magnetic Stimulator Unit equaled 2 Tesla.
For the second set of experimental studies, we recruited 8 healthy male volunteers 18 to 24 years of age to test the muscular strength variations (based on the angular momentum values) with the increased frequencies and intensities of the magnetic/ electric stimulating impacts.
In the first stage of these studies, we explored the effects of the both classes of stimulating impacts on the angular momentum intensities of relaxed muscles depending on the impact frequency rates. The subjects in sitting positions were tested by the sequence of single-phase and two-phase electric impacts, followed by the magnetic stimulation tests using Biodex System, with the impact intensities being high enough to secure the angular momentum of the foot plantar flexion coming to 3 Nm. The active electric stimulation electrode was fixed on the motor point of the GM medial head; and the indifferent electrode was shifted to the tendon. In the magnetic stimulation test, the flat 50mm coil was placed on the GM medial head projection point. The stimulating impact intensity was rated on an individual basis. The frequency rates for every class of the stimulation tests were increased in a step-by-step manner from 1 HZ to 25 Hz, with every stimulating pulse series lasting for 5 seconds. There were 30-second relaxation breaks in between the stimulating pulse series, and the larger breaks of 3 minutes when switching from one stimulation test class to the other.
The second set of experimental studies was designed to analyze the angular momentum rate variations with the intensity of every next stimulation session being raised by 10% and the stimulation pulse frequency being kept invariable at 10 Hz. The pulse series duration time and locations of the electric stimulation electrodes and the magnetic stimulation coil were the same as in the first set of the tests. At first, the stimulation intensity was tailored to every individual subject so as to achieve the angular momentum amplitude of 3 Nm with the stimulation pulse frequency being kept invariable at 10 Hz. Then every volunteer was tested by the sequence of single-phase and two-phase electric impacts followed by the magnetic stimulating tests with the 30-second relaxation breaks in between the stimulating pulse series and the longer 5-minute breaks when switching from one stimulation test to the other.
Results and discussion. As seen from our study of the H-reflex test data, the H-reflex amplitudes for the tested muscles showed regular variations with the growing intensities of the magnetic and electric stimulating impacts (Figure 1).
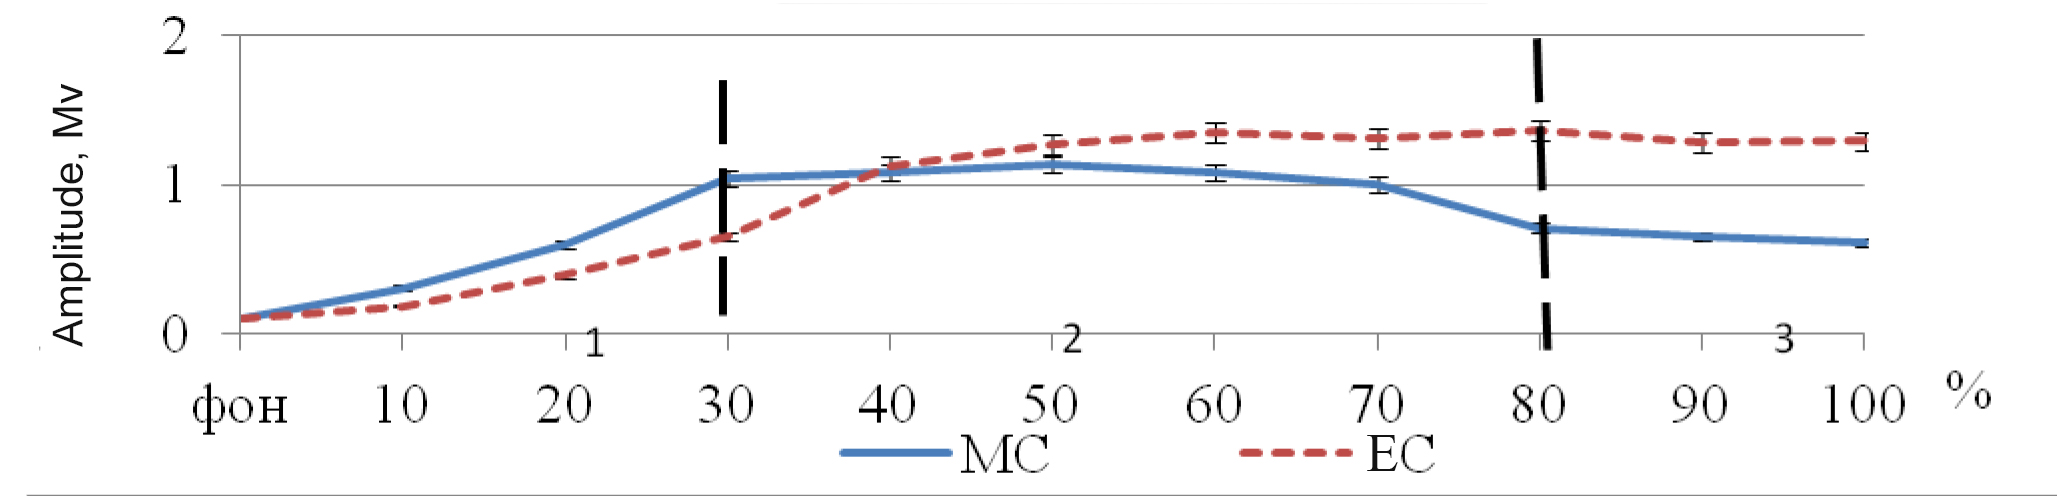
Figure 1. H-reflex amplitude variations with the growing intensities of the magnetic and electric stimulating impacts on m. gastrocnemius muscle:
Vertical axis: H-reflex amplitude, mV; horizontal axis: impact growth in % to the background value; blue line: magnetic stimulation; red dotted line: electric stimulation tests
At first, the H-reflex amplitude was rapidly on the rise with the gradually increasing intensity of the electric and magnetic stimulation pulses; thereafter it came to some stable level; and with the further growth of the stimulation process, the responses drastically sagged. It is a common knowledge today that an excitement wave induced by electric impact in the efferent nerve fiber may flow both in an orthodromic and antidromic manner [3]. This may be the reason for the H-reflex amplitude rapidly falling with the excessive rise of the magnetic stimulating impact, which is probably due to the responsive surge of mono-neurons being blocked by the counter antidromic flow of nervous impulses in the efferent fibers.
The M-response amplitude was on the rise with the growing intensity of the stimulating impacts (Figure 2).
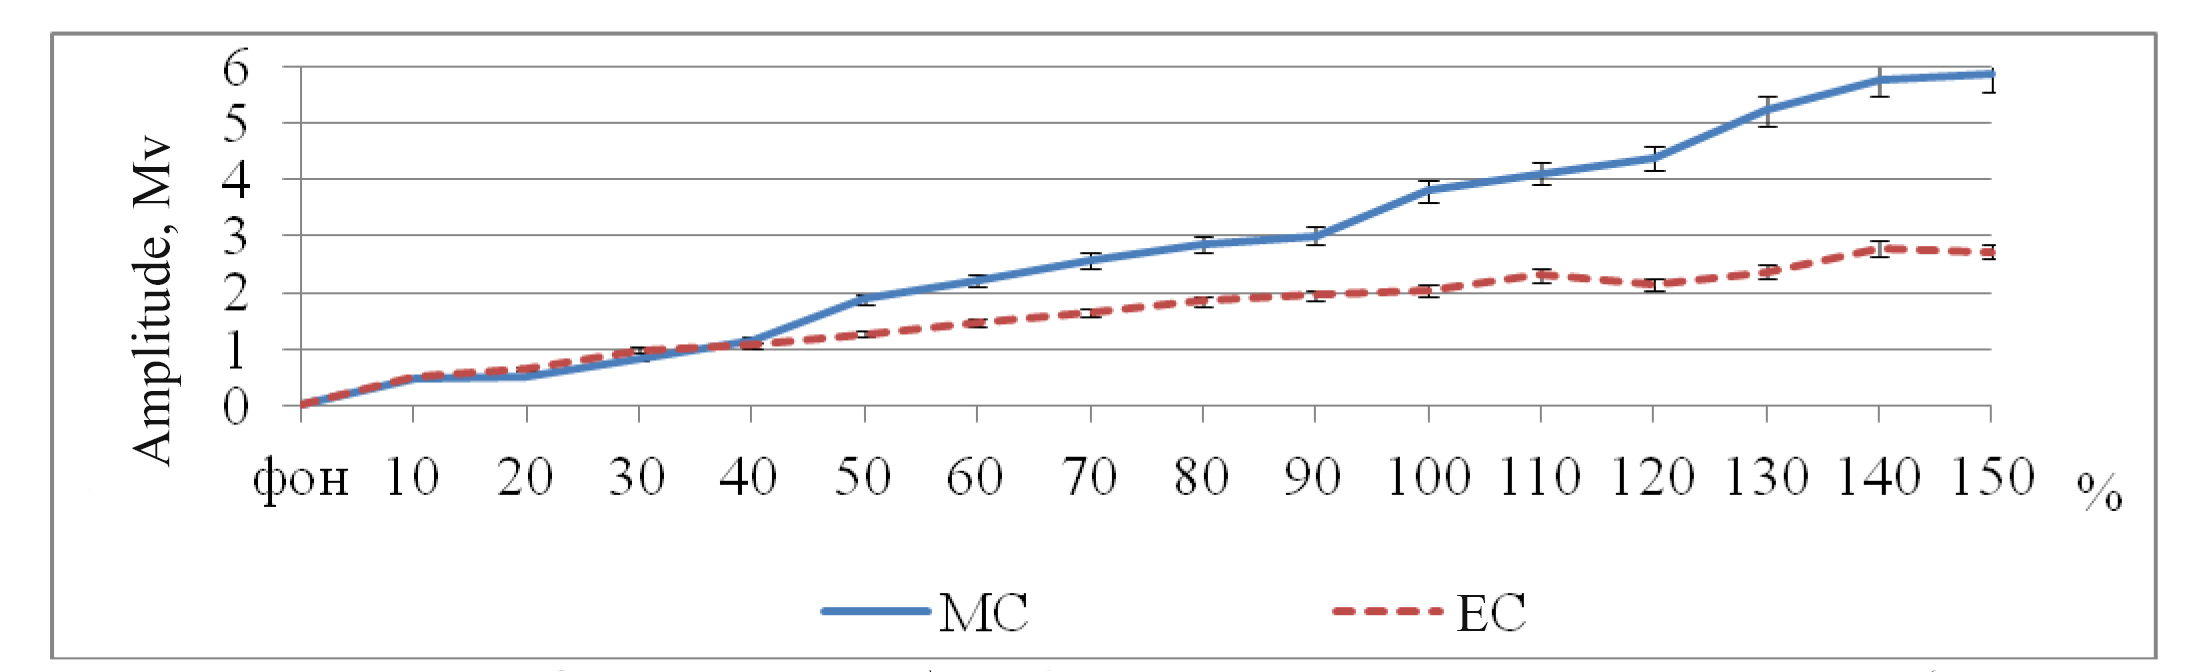
Figure 2. M-response (of m. gastrocnemius) amplitude variation with the growing intensity of the stimulating impacts.
Vertical axis: M-response amplitude, mV; horizontal axis: impact growth in % to the background value; blue line: magnetic stimulation; red dotted line: electric stimulation tests
It should be noted that the magnetic stimulation test required relatively lower-intensity impacts (vs. the background level) to achieve the peak values of H-reflexes than the electric stimulation tests. The same phenomenon was noted in the case of the M-response reaching the peak value with the growing stimulation impacts. It may be also important to emphasize that the H-reflex and M-response peak value registration was somewhat complicated by pain caused by the single-impact electric stimulation tests as the tested subjects complained; whilst the magnetic stimulation tests were reported to cause no painful sensations.
The second set of experimental tests demonstrated that the angular momentum was on the rise with the growing frequencies in all the three classes of the stimulation tests (Table 1).
Table 1. Angular momentum intensity (Nm) variation with growing frequency of magnetic and electric stimulation impacts (М ± m, n = 8)
|
Stimulation test classes |
Background |
Stimulating pulse frequency, Hz |
||||
|
5 |
10 |
15 |
20 |
25 |
||
|
Magnetic |
2,08 ± 0,03 |
2,18 ± 0,30 |
3,75 ± 0,69* |
6,25 ± 1,05* |
8,50 ± 1,61* |
9,11 ± 1,61* |
|
Single-phase electric |
2,11 ± 0,05 |
2,47 ± 0,23 |
5,96 ± 1,07* |
10,92 ± 2,00* |
15,76 ± 3,33* |
19,46 ± 4,13* |
|
Two-phase electric |
2,17 ± 0,04 |
3,08 ± 0,52 |
6,41 ± 0,70* |
11,96 ± 1,16* |
15,50 ± 1,58* |
19,10 ± 1,37* |
*Difference reliability rate for the data reading vs. its background value was estimated at p<0.05
It should be further mentioned that the single-phase and two-phase electric stimulation tests caused more intense muscular contractions and, consequently, higher angular momentum amplitudes than the magnetic stimulation impacts. In the specific terms, the 25Hz magnetic/ single-phase electric/ and two-phase stimulation impacts caused the angular momentum amplitudes to grow by 7.03 Nm/ 17.35 Nm/ and 16.93 Nm, respectively.
It was found that the angular momentum of the tested muscles was on the rise with the growing intensity in every stimulation test class (Table 2 hereunder).
Table 2. Angular momentum intensity (Nm) variation with growing frequency of magnetic and electric stimulation impacts (М ± m, n = 8)
|
Stimulation test class |
Background |
Stimulating pulse frequency vs. background value, % |
|||||
|
10 |
20 |
30 |
40 |
50 |
60 |
||
|
Magnetic |
2,83± 0,05 |
3,01± 0,28 |
3,7± 0,29* |
5,06±0,45* |
5,9± 0,61* |
6,95± 0,45* |
8,23± 0,75* |
|
Single-phase electric |
3,01± 0,06 |
4,75± 0,28* |
6,53± 0,47* |
8,90±1,02* |
10,2± 0,83* |
12,6± 1,61* |
14,2± 2,06* |
|
Two-phase electric |
2,91±0,06 |
3,95± 0,30 * |
4,76± 0,26* |
6,92±0,55* |
8,15± 0,75* |
9,72± 0,95* |
12,3± 1,38* |
*Difference reliability rate for the data reading vs. its background value was estimated at p<0.05
Analysis of the test data given above in Table 2 demonstrates that the peak values of the angular momentum achieved in the single-phase and two-phase electric stimulation tests were respectively by 6.05 Nm and 4.08 Nm higher than that in the magnetic stimulation test. However, the electric stimulation tests nearing the peak values were somewhat painful for the tested volunteers, while the magnetic stimulation tests reported to cause no unpleasant sensations.
Conclusion. High-intensity magnetic stimulation provides a tool for painless activation of human neuromuscular system. It may also be applied for rehabilitation of body motor functions impaired by injuries of spinal cord and/or skeletal muscles, and for the muscular strength enhancement purposes.
References
- Andriyanova, E.Yu. Funktsional'naya plastichnost' spinnomozgovykh nervnykh tsepey na fone dolgovremennoy sportivnoy deyatel'nosti (Functional plasticity of spinal nerve circuits on the background of long-term sports activity) / E.Yu. Andriyanova, O.V. Lanskaya // Fiziologiya cheloveka. – 2014. – № 3. – P. 73–85.
- Gorodnichev, R.M. Chrezkozhnaya elektricheskaya stimulyatsiya spinnogo mozga: neinvazivny sposob aktivatsii generatorov shagatel'nykh dvizheniy u cheloveka (Transcutaneous electrical stimulation of spinal cord: non-invasive method to activate generators for stepping movements in man) / R.M. Gorodnichev, E.A. Pivovarova, A.G. Pukhov et al // Fiziologiya cheloveka. – 2012. – № 2. – P. 46–56
- Kotz, Ya.M. Organizatsiya proizvol'nogo dvizheniya (Voluntary movement organization) / Ya.M. Kotz. – Moscow: Nauka, 1975. – 248 P.
- Guissard, N. Effect of static stretch training on neural and mechanical properties of the human plantar-flexor muscles / N. Guissard, J. Duchateau // Muscle Nerve. – 2004. – Feb, 29. – P. 248-255.
- Inghilleru, M. Corticospinal potentials after transcranial stimulation in humans / M. Inghilleru, A. Berrardelli, G. Cruccu, A. Priori, M. Manfrdi // Journal of Neurology, Neurosurgery and Psychiatry.-1989. 52, 970-974.
Corresponding author: fizkult@teoriya.ru


 Журнал "THEORY AND PRACTICE