Physical activity and fitness tests of secondary schoolchildren versus their health self-rating survey data
ˑ:
Dr. Hab., Professor V.F. Kostyuchenko1
PhD, Associate Professor V.E. Lutkovsky1
PhD S.M. Sukhareva1
1Lesgaft National State University of Physical Education, Sport and Health, St. Petersburg
Keywords: 11-15 year old schoolchildren, physical fitness, tests.
Background. Physical education and sport service is in growing priority in the modern societies [1-3], with physical culture persistently developed since the childhood. However, the national educational system reports the children’s health deterioration trends due to the growing education workloads, time limitations and physical inactivity [1]. The expanding physical inactivity and the associating problems have always been central for the relevant governmental agencies and education system. The health trends countering efforts include the healthy lifestyle promotion initiatives, school sports, optional sport groups in the school physical education system and other projects by highly competent physical education specialists [6]. Special studies are always needed to rate benefits of the health projects and initiatives and the schoolchildren’s motivations for physical activity [5].
Objective of the study was to rate the 11-15 year old schoolchildren’s physical activity and fitness by integrated tests and self-rating questionnaire survey.
Methods and structure of the study. Sampled for the study were the 11-15 year old schoolchildren (n=406) from 5-9 grades of a few secondary schools in St. Petersburg downtown. Their motivations for physical education and sport service, physical fitness, off-class training experiences and sporting backgrounds and agendas of their families were rated by a questionnaire survey, with the study data used to assess efficiency of the school physical education and sport service.
Results and discussion. The first-stage tests were designed to rate the physical fitness of the sample by a few test exercises [4] scored on a 5-point scale, with the excellent and poor performance scored by 5 and 1 points, respectively. The test data were analyzed on a gender-specific basis to find a few variations: see Figure 1 hereunder. Thus we found a wavelike pattern in the boys’ physical fitness variation in the 11-15 age range. On the whole, the 12- and 15-year-old boys were tested with average physical fitness in most of the tests with the only exclusion for the sitting bents test that yielded under-median values for every age group. The 13-year-old boys were tested with the lowest physical fitness, particularly in the movement coordination and speed-strength aspects.
The girls’ subsample showed somewhat different trend with their physical fitness tested to sag with age. Thus the endurance rating 6-min run test found the subgroup endurance falling from above-average in the 11-13-year old to average in the 14-15 year old girls, with every age group tested with relatively low flexibility and speed-strength qualities.
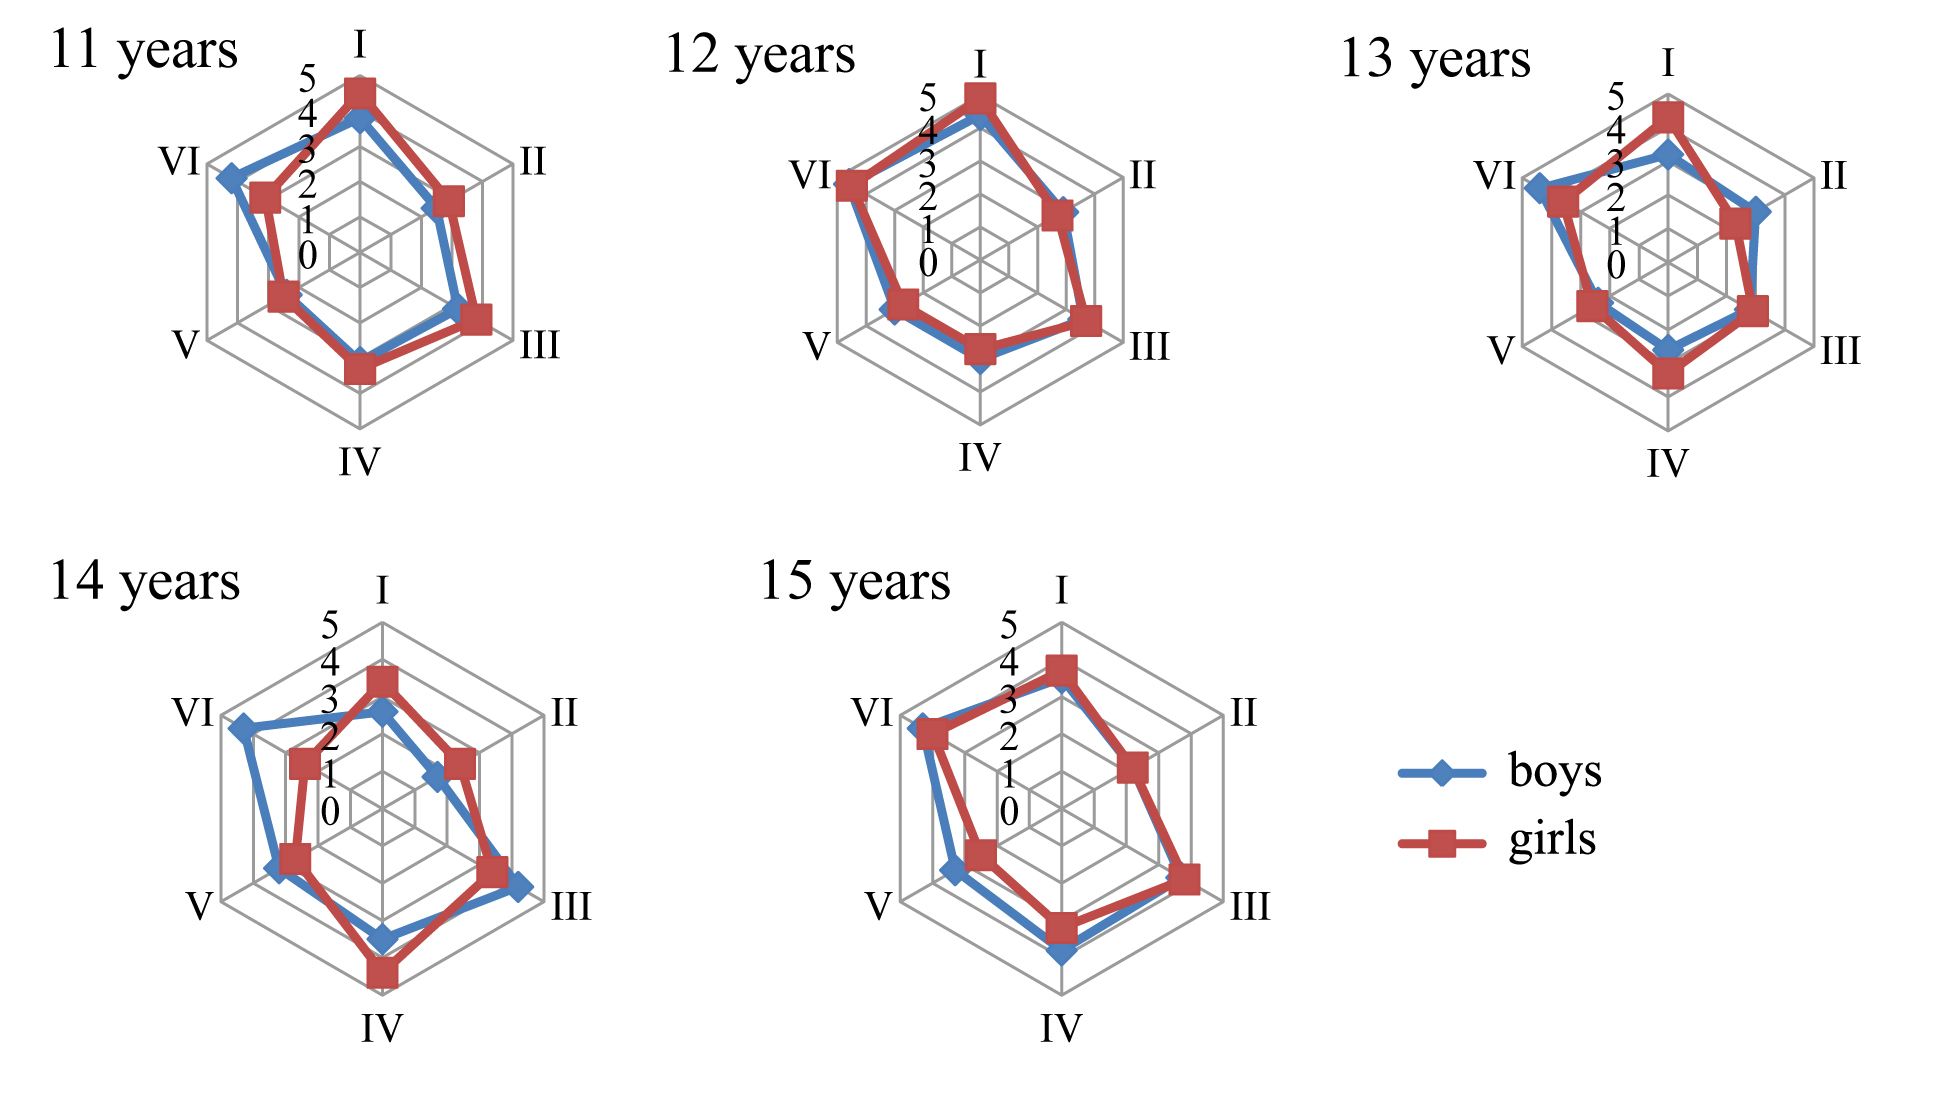
Figure 1. Physical fitness rates, points;
I – endurance rating 6min run test; II – flexibility rating sitting bents test; III – coordination rating 3x10m shuttle run test; IV – speed rating 30m sprint test; V – speed-strength rating standing long jump test; VI – strength rating supine-to-sit test
boys girls
The physical education and sport role and motivations were indirectly rated by the physical fitness self-rating questionnaire survey at the second stage of the study to obtain the specific and total physical fitness and willpower self-rates. The questionnaire survey form offered four groups of questions: see Table 1. On the whole, the physical fitness self-rates were in the middle of the 5-point scale in both gender subgroups, with some self-overrating in the boys’ subgroup – albeit generally the test data may be interpreted as indicative of a quite critical attitude of the sample to \ own physical fitness, appearance and willpower/ motivations in the physical education and sport domain.
Table 1. Self-rates (points), М ± m
|
Personality credentials |
Boys |
Girls |
|
Key physical qualities |
3,6 ± 1,2 |
3,3± 1,2 |
|
Physical resource and skills |
4,0 ± 1,1 |
3,6 ± 1,2 |
|
Appearance: tall, slim etc. |
3,5 ± 1,3 |
3,3 ± 1,2 |
|
Courage, determination, willpower |
3,8 ± 1,1 |
3,6 ± 1,2 |
|
Total self-rate |
3,7 ± 1,2 |
3,4 ± 1,2 |
We made a correlation analysis to find how accurate the reported self-rates are. The analysis found virtually no correlation between the actual physical qualities and fitness and the children’s perceptions thereof – that means that people of this age group are still unable to fairly rate their own qualities and resource being prone to over-/ under-estimations: see Table 2.
Table 2. Actual physical fitness test rates versus self-rates
|
Physical fitness tests |
Physical fitness self-rates |
Boys, r |
Girls, r |
|
6-min run test, m |
Endurance |
0,26* |
0,09 |
|
Sitting bents test, cm |
Flexibility |
0,08 |
0,2* |
|
3х10m shuttle run test, s |
Coordination |
-0,13 |
0,13 |
|
30m sprint test, s |
Speed |
0,03 |
0,15 |
|
Standing long jump test, cm |
Speed-strength |
0,11 |
0,09 |
|
Supine-to-sit test, count |
Strength |
0,01 |
0,01 |
* significance of correlation (р≤ 0.05)
The physical fitness tests and self-rates were substantiated by survey of the sporting agendas and actual practices in the sample plus the sporting/ physical education backgrounds of their families to find a few regularities. Thus only 55.8% of the sample was found to go in for active sports, with 44.2% keeping off sports; although 53.9% of the unsporting group reported prior sporting experiences. The 55.8% of the sporting group include 31.1% males and 24.7% females: see Table 3.
Table 3. Sporting agendas and sporting/ physical education family backgrounds of the sample, %
|
Sporting agendas |
Children |
Families |
||||
|
Total |
Boys |
Girls |
Total |
Men |
Women |
|
|
Sporting |
55,8 |
31,1 |
24,7 |
36,4 |
17,5 |
18,9 |
|
Unsporting |
44,2 |
19,4 |
24,8 |
63,6 |
29,9 |
33,7 |
|
Prior sport experience* |
53,9 |
19,8 |
34,1 |
- |
- |
- |
*in the unsporting group
The study found certain correlations in the children’s versus families’ sporting agendas. Thus only 36.4% of the family members reported going in for some sport, with the remaining 63.6% fully unsporting. The sporting family population was tested 17.5% male and 18.9% female. This finding gives grounds to believe that children tend to copy the sporting agendas of their families with their physical activity or inactivity. The sporting agendas of the families and children were found different only in gender aspect since in the children’s sample boys were tested more interested in sports whilst in the families sample more prone to sports were women.
Conclusion
- The study data and analyses showed serious disagreements between own health ratings by the children and the objective physical fitness test data. Thus the girls were tested more prone to reflection and critical attitude to own physical fitness and individual traits than the boys, although the objective tests found physical fitness of the sample falling within the age norm.
- Only 55.8% of the sample (31.1% male and 24.7% female) was qualified with the sporting group. It should be noted that 53.9% of the unsporting group reported having a prior sporting experience.
- Only 36.4% of the family members (17.5% male and 18.9% female) reported going in for some sport.
- Family sporting agendas were found to determine the children’s ones.
- Boys were tested more prone to sports than girls, with the gender proportion found opposite in their families.
References
- Global physical activity recommendations for health. [Electroic resource] WHO. Available at: https://www.who.int/dietphysicalactivity/factsheet_recommendations/ru/ – (03.03.2019).
- Kostyuchenko V.F., Kozlov S.S., Vrublevskiy E.P. Formation of citizens' physical culture in context of strategy for development of physical education and sports in the Russian Federation. Uchenye zapiski universiteta im. P.F. Lesgafta. 2017. no.5 (147). pp. 78-81.
- Kostyuchenko V.F., Rudenko G.V., Dubrovskaya Yu.A. Mass physical culture encouragement policies in context of national physical education and sports sector development strategy. Teoriya i praktika fiz. kultury. 2019. no. 3. pp. 38-40.
- Lyakh V.I., Zdanevich A.A. Comprehensive PE program of 1-11 grade students. RMES. 4th ed. M.: Prosveshchenie, 2007. 127 p.
- Sukhareva S.M. Methods to facilitate physical activity of secondary school children. Uchenye zapiski universiteta im. P.F. Lesgafta. 2014. no. 9 (115). pp.. 148-152.
- Lubysheva L.I. Social vector of changes in pupils' attitude to physical education and sports. I.M. Salakhov Fizicheskaya kultura: vospitanie, obrazovanie, trenirovka. 2017. no. 2. pp. 71-73.
Corresponding author: vf-kost@mail.ru
Abstract
Physical education and sport service is commonly in high priority in modern societies, and the governmental education policies are geared to popularize and integrate modern physical education and sport service in the school programs. Sampled for the study were the 11-15 year old schoolchildren who were subject to integrated physical activity and fitness tests to rate the school physical education and health service quality. Standard educational progress tests, however, are often one-sided in fact as they rate only the interim results of the school physical education and health service system and fail to rate the optional ways to success. Questionnaire surveys give an insight to the preferences and physical activity of the teenage school population albeit cannot test the physical education service quality on an integrated basis. The article analyzes the integrated physical test data on the 11-15-year-olds to assess their physical fitness; and rates their attitudes to different school physical education and sport services that were probed by a questionnaire survey.
The study data and analyses showed serious disagreements between the own health ratings by the children and the objective physical fitness test data. Thus the girls were tested more prone to reflection and critical attitude to own physical fitness and individual traits than the boys, although the objective tests found physical fitness of the sample falling within the age norm.


 Журнал "THEORY AND PRACTICE