Elite swimmers’ fitness test technology driven by active metabolism rate variation analysis versus swimming speed test rates
ˑ:
Dr.Biol., Professor S.V. Kolmogorov1
PhD, Associate Professor А.Р. Vorontsov2
PhD, Associate Professor O.A. Rumyantseva1
1Northern (Arctic) Federal University named after M.V. Lomonosov, Arkhangelsk
2University of Bath, Bath, United Kingdom
Keywords: active metabolism test rate, mechanical and propulsion movement efficiency ratios, swimming speed.
Background. Whatever is the swimming style, the generated metabolic power net of some energy costs is initially transferred into mechanical power – that is transferred in its turn, net of its own losses, into the swimming speed. This process for competitive swimming was described by the following mathematical model [6]: v0 = Pai•eg•ep•Fr(f.d.)-1, where v0 means the average interval speed {мs-1}; Pai means the active energy metabolic power {Вт}; eg means the mechanical efficiency ratio i.e. the total mechanical power Pto to Pai ratio; ep means the propulsive movement efficiency ratio i.e. the efficient mechanical power Puo to Pto ratio; and Fr(f.d.)means the active hydrodynamic front resistance rate {Н}.
Methods and structure of the study. Sampled for the analytical model testing experiment were 3 elite swimmers trained in 25m swimming pools prior to the 2014 World Swimming Championship in Doha, Qatar. The tests were timed to the specific precompetitive training periods: see Table 1.
Table 1. Test periods in the winter training cycle
|
Winter training cycle: September 1 to December 7, 2014 |
|||
|
3-week preparatory training period: September 01–21 |
3-week aerobic strength training period: September 22 - October12 |
5-week special training period: October 15 – November 16
|
3-week eased training phase and competitions: November 17 to December 7 |
|
Test 1: September 6-9 |
Test 2: September 26-29 |
Test 3: September 25-27 |
Test 4: November 17-20 |
In every test the swimmers were first tested in the hydrodynamic channel and second in the 25 pool after a 72-hour rest break, with the tests designed on a distance-specific basis as follows. The short-distance swimmers (sprinters) were tested by eight 1-minute swimming intervals in the hydrodynamic channel and eight 100m intervals in the pool; and the mid-distance swimmers were tested by eight 2-minute channel tests and eight 200m pool swimming tests; with 3min and 5min rest breaks after intervals 1-2-3-4 and 5-6, respectively.
The swimmers were requested to gradually increase the interval swimming speed to guarantee the transition from the aerobic metabolic threshold to the maximal metabolic power. The speed acceleration for every swimmer was assisted by the SwimPlanyzer application software [1] that produced the individual swimming speeds for the channel and pool test intervals; plus the swimmers were assisted and guided in the tests by a light leader system.
Ventilation air flows in the channel tests were metered by the stationary MetaSwim performance physiology test system; and in the pool tests the air flows were tested within the first 2 minutes of each rest break by a mobile MetaMax performance physiology test system. In addition, we rated the capillary blood lactate prior to and after every interval test to produce the post-work peak rates and profile their variability after the tests.
The active metabolic power (Pai) was computed using an indirect colorimetric method based on the work time and directly metered energy costs [3, 4]. In the channel tests, the active metabolic energy (Eai) was found (by the direct gas analyses and biochemical measurements) as a product of the following three components: Eai (o.s.) oxidation system energy; Eai (f.s.) phosphate generation system energy; and Eai (l.s.) lactate generation system energy. In the pool tests, Eai (f.s.) and Eai (l.s.) rates were computed based on the directly metered physiology rates and Eai (o.s.) was rated by an inverse extrapolation method [8, 12] based on the individual energy system contributions to the Eai rates produced by the channel tests.
The total mechanical power (Pto); dimensionless mechanical efficiency ratios (eg); propulsive movement efficiency ratios (ep); and the active hydrodynamic front resistance rates (Fr(f.d.)) – were found in the pool tests by the performance physiology test methods [2].
Results and discussion. Given on Figure 1 hereunder are the individual (female swimmer F1) test data profiles in the interval pool swimming (eight 100m crawl stroke intervals) tests.
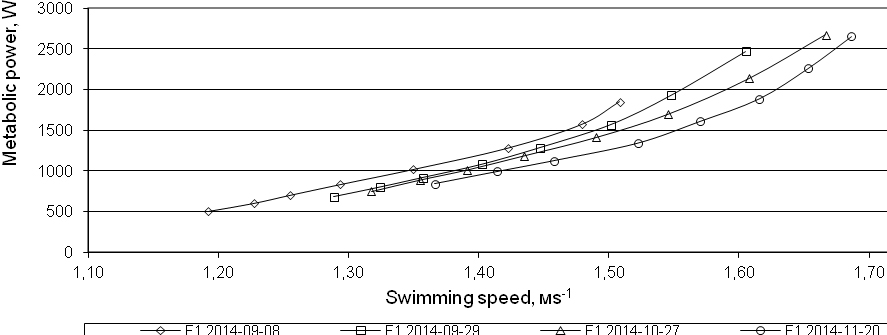
Figure 1. Metabolic power versus the test period speeds variation curves: female swimmer F1 (184cm high weighing 62.4kg) specialized in the 50/100m freestyle
The test data showed the individual training program being successful as verified by the metabolic power growing on a gradual basis in the whole range of the interval test speeds. That means that the same swimming speeds in tests 2, 3 and 4 are secured by the gradually falling energy costs i.e. metabolic power rates Pai. It is also important that the accurate and interrelated current functionality (Pai), strength (eg) and technical (ep) fitness rates (Table 2) provide the coach with a detailed data for the speed variability analyses to make, when necessary, corrections to the individual training system [7].
Table 2. Final interval test rate variations: female swimmer F1
|
Test |
Swimming pool |
Channel |
||||||
|
V0exp, мs-1 |
Pai, W |
Pto, W |
eg |
ep |
Fr(f.d.), N |
V0exp, мs-1 |
Pai, W |
|
|
1 |
1,51 |
1848 |
77,87 |
0,042 |
0,61 |
31,45 |
1,40 |
1793 |
|
2 |
1,61 |
2471 |
99,06 |
0,040 |
0,65 |
39,99 |
1,45 |
2495 |
|
3 |
1,67 |
2676 |
120,87 |
0,045 |
0,63 |
45,60 |
1,49 |
2628 |
|
4 |
1,69 |
2658 |
132,86 |
0,050 |
0,69 |
54,24 |
1,51 |
2627 |
Energy systems contributions analysis upon Test 4 (Eai(o.s.) = 62.11 kJ = 41%; Eai(f.s.) = 38.37 kJ = 25%; and Eai(l.s.) = 50.74 kJ = 34%) gave grounds to classify the athlete’s metabolism with the anaerobic type (with the dominant contribution of the lactate energy generation system to the total metabolism) versus the average statistics for the elite 100m swimmers [4, 9].
Comparative analysis of the pool versus channel Pai and v0exp test rates confirmed the well known experimental fact that the channel speeds are generally lower than the pool ones at the same metabolic power levels [5, 11]. This is arguably the key reason for the coaches facing problems in practical application of the multiple experimental data produced by the channel tests.
Given in Figure 2 and Table 3 hereunder are the interval (eight 100m breast stroke intervals) performance test rates of male swimmer M8 – that show the individual training program in the case being as successful as the F1 one. Energy systems contributions analysis upon Test 4 (Eai(o.s.) = 91.63 kJ = 50%; Eai(f.s.) = 40.09 kJ = 21%; and Eai(l.s.) = 62.88 kJ = 29%) gave reasons to qualify the athlete’ metabolism with the balanced type [4, 9].
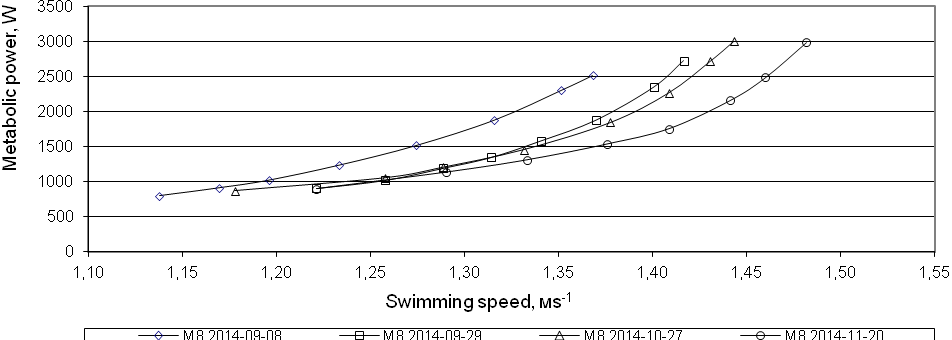
Figure 2. Metabolic power versus the test period speeds variation curves: male swimmer M8 (192cm high weighing 84.4kg) specialized in the 50/100/200m breast stroke
Table 3. Final interval test rate variations: male swimmer M8
|
Test |
Swimming pool |
Channel |
||||||
|
V0exp, мs-1 |
Pai, W |
Pto, W |
eg |
ep |
Fr(f.d.), N |
V0exp, мs-1 |
Pai, W |
|
|
1 |
1,37 |
2517 |
89,64 |
0,036 |
0,59 |
38,60 |
1,29 |
2544 |
|
2 |
1,42 |
2723 |
118,44 |
0,043 |
0,67 |
55,88 |
1,31 |
2745 |
|
3 |
1,44 |
3006 |
150,07 |
0,050 |
0,68 |
70,87 |
1,32 |
3087 |
|
4 |
1,48 |
2989 |
179,67 |
0,063 |
0,74 |
89,83 |
1,34 |
3033 |
Given in Figure 3 and Table 4 hereunder are the interval (eight 200m back stroke intervals) performance test rates of female swimmer F5 – that show the individual training program in the case being successful in the preparatory and aerobic strength training periods as verified by the metabolism and final-stage speed growth curves with growths of Pai, eg and ep rates. However, in the special training period the metabolic curve shows an abnormal shift to the left within the whole speed range due to the ep fall – indicative of some training process imbalances. This was the reason for the personal coach to timely adjust the technical training component to secure ep growth by a special technology. The technology was developed based on the CDP- mechanism testing experiment to analyze the elite swimmers’ known ability to keep up the maximal speed regardless of the Pto falls or growths [2, 10].
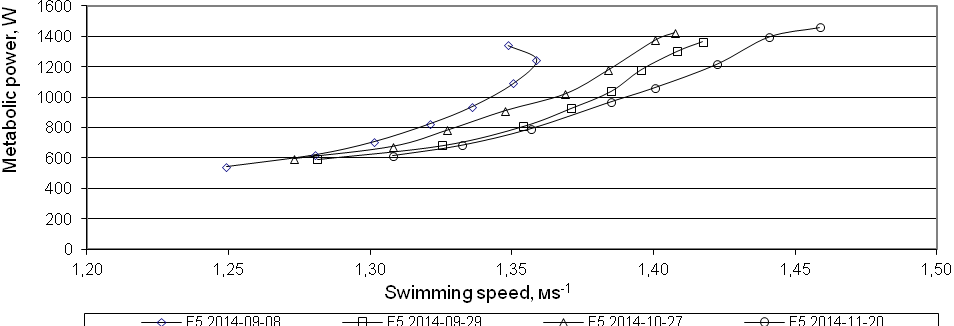
Figure 3. Metabolic power versus the test period speeds variation curves: female swimmer F5 (181cm high weighing 67.2kg) specialized in the 200m back stroke
The above corrections to the training program in the middle of the period prior to the eased training stage made it possible to secure the optimal metabolic curve with the V0exp growth in the final test stage due to the achieved ep growth. Energy systems contributions analysis upon Test 4 (Eai(o.s.) = 132.96 kJ = 70%; Eai(f.s.) = 31.37 kJ = 16%; Eai(l.s.) = 27.30 kJ = 14%) %) gave grounds to classify the athlete’s metabolism with the aerobic type [4, 9].
Table 4. Final interval test rate variations: female swimmer F5
|
Test |
Swimming pool |
Channel |
||||||
|
V0exp, мs-1 |
Pai, W |
Pto, W |
eg |
ep |
Fr(f.d.), N |
V0exp, мs-1 |
Pai, W |
|
|
1 |
1,35 |
1339 |
58,53 |
0,044 |
0,62 |
26,88 |
1,27 |
1360 |
|
2 |
1,42 |
1363 |
66,82 |
0,049 |
0,68 |
32,01 |
1,31 |
1331 |
|
3 |
1,41 |
1421 |
77,32 |
0,054 |
0,59 |
32,15 |
1,32 |
1476 |
|
4 |
1,46 |
1457 |
77,53 |
0,053 |
0,76 |
40,36 |
1,35 |
1475 |
Conclusion. The elite swimmers performance physiology tests with the active metabolic power rates analyzed versus the test period specific pool swimming speed were found to largely improve the training process management efficiency due to the coach being provided with the dependable and timely test data to both rate the current performance and fitness and correct the training system on the run when necessary.
References
- Kolmogorov S.V., Lyapin S.Kh., Kukovyakin A.V. Kompyuternoe modelirovanie biogidrodinamicheskikh protsessov: informatsionnaya sistema dlya planirovaniya i analiza trenirovochnoy deyatelnosti vysokokvalifitsirovannykh sportsmenov-plovtsov [Computer simulation of biohydrodynamic processes: information system for planning and analyzing training activities of elite swimmers]. Nauchno-tekhnicheskaya politika i razvitie novykh otrasley ekonomiki Arkhangelskoy oblasti [Scientific and technological policy and development of new sectors of economy of the Arkhangelsk region]. Arkhangelsk: Pravda Severa publ., 1998. pp.120-131.
- Kolmogorov S.V. Kinematicheskie i dinamicheskie kharakteristiki ustanovivshegosya nestatsionarnogo dvizheniya elitnykh plovtsov [Kinematic and dynamic characteristics of steady non-stationary movement of elite swimmers]. Rossiyskiy zhurnal biomekhaniki [Russian Journal of Biomechanics]. 2008.no. 4. pp. 59–74.
- Utkin V.L. Optimizatsiya sportivnykh lokomotsiy na osnove modelirovaniya energetiki myshechnogo sokrashcheniya [Optimization of sports locomotions based on energy modeling of muscle contraction]. Sovremennye problemy biomekhaniki [Contemporary problems of biomechanics], 1993, no. 7, pp. 5–22.
- Capelli C., Pendergast D.R., Termin B. Energetic of Swimming at Maximal Speeds in Humans. Europ. J. Appl. Physiol. 1998. Vol. 78. pp. 385–393.
- Hay H.G., do Carmo J. Swimming techniques used in the flume differ from those used in a pool. Proc. XV ISB congress. University of Jyvaskyla, 1995. pp. 372-373.
- Kolmogorov, S. Transformation effectiveness of elite swimmers metabolic and mechanic energy. Proc. XII FINA World congress on sports medicine. Goteborg: Chalmers Reproservice, 1997, pp. 453–462.
- Kolmogorov S.V., Vorontsov A.R., Rumyantseva O.A., Kochergin A. B. Mechanical and propulsive efficiency of swimmers in different zones of energy supply. Proceedings of the XI International Symposium for Biomechanics and Medicine in Swimming. – Oslo: Published by Norwegian School of Sport Science, 2010. pp. 110 – 122.
- Schuller T., Hoffmann U., Iglesias X., D. Chaverri, F. Rodriguez Concurrent validity of a new model for estimating peak oxygen uptake based on post-exercise measurements and heart rate kinetics in swimming. Proceedings of the XII International Symposium for Biomechanics and Medicine in Swimming. – Canberra: Published by Australian Institute of Sport, 2014, pp. 506-511.
- Troup J. International center for aquatic research: Studies by international center for aquatic research 1991 – 1992. Colorado Springs: USS Press, 1992, 179 p.
- Toussaint H. M. Biomechanical aspects of peak performance in human swimming. Animal Biology. 2005, no. 55, pp. 17 – 40.
- Wilson B., Takagi H., Pease D. Technique comparison of pool and flume swimming. Proceedings of the VIII International Symposium for Biomechanics and Medicine in Swimming. Jyvaskyla: Gummers Printing, 1999, pp. 181-184.
- Zacca R., Lopes A., Teixeira B., Matos C., Engelmann L., Castro F. VO2 assessed by backward extrapolation in 200, 400, 800, and 1500 m front crawl in youth swimmers. Proceedings of the XII International Symposium for Biomechanics and Medicine in Swimming. Canberra: Published by Australian Institute of Sport, 2014, pp. 530-536.
Corresponding author: svkolmogorov@yandex.ru
Abstract
The authors developed and tested an elite swimmers’ performance physiology and fitness test technology driven by the active metabolism variability versus swimming speed analysis, with the functionality, strength, technical fitness and swimming technique test rates analyzed in a training cycle to improve the swimming speeds on a style- and distance-specific basis. We applied for the study a range of educational, physiological, hydrodynamic, biomechanical and ergometric test methods plus computer modeling and mathematical data processing toolkits. The new technology testing experiment was run in a 25m swimming pool in the winter training cycle (including the preparatory, aerobic-strength, special, eased training and competitive periods) prior to the 2014 World Swimming Championship in Doha, Qatar. In every of the above periods, special interval tests with the stepped flow rates in the hydrodynamic channel and open swimming pool tests were applied to rate the key performance parameters including the active energy metabolism rates; mechanical and propulsive movement efficiency ratios; and the active hydrodynamic front resistance rate. The new test technology gives the means for the coaching teams to rate efficiency of every individual training system in every training cycle and efficiently plan and manage the training process.


 Журнал "THEORY AND PRACTICE